Fig. C.1
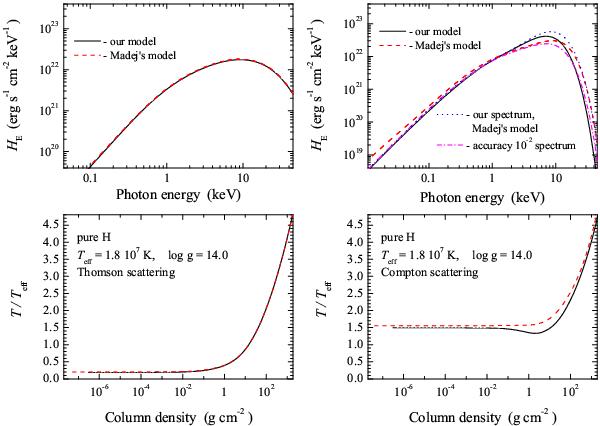
Left panels: comparison of emergent spectra and temperature structures of the models computed by our code (solid curves) and Madej’s code (dashed curves), when electron scattering is approximated by coherent Thomson scattering. Right panels: same as left, but when the exact RF was used to compute Compton scattering. The spectrum computed by us using the Madej’s temperature structure is shown by the dotted curve and the spectrum computed with a relative accuracy of 10-2 is presented by dash-dots.
Current usage metrics show cumulative count of Article Views (full-text article views including HTML views, PDF and ePub downloads, according to the available data) and Abstracts Views on Vision4Press platform.
Data correspond to usage on the plateform after 2015. The current usage metrics is available 48-96 hours after online publication and is updated daily on week days.
Initial download of the metrics may take a while.