Fig. 13
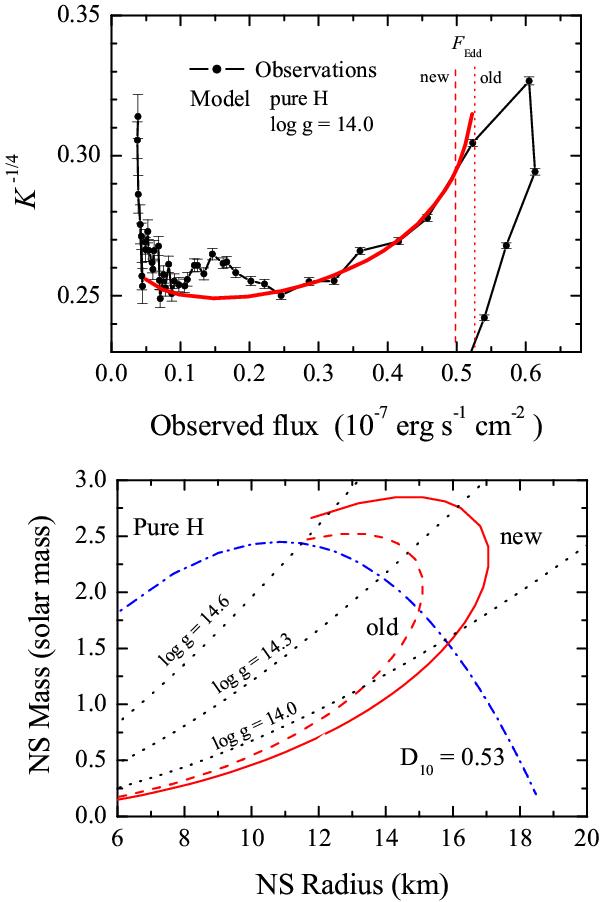
Top panel: the fit of the X-ray burst data for 4U 1724–307 by the theoretical models for the NS atmosphere. The circles indicate the observed dependence of K−1/4 versus F for the long burst (S11) and the solid curve corresponds to the best-fit theoretical model for a pure hydrogen atmosphere and log g = 14.0. Vertical dotted and dashed lines show the best-fit value for FEdd for the old and new models. Bottom panel: constraints on mass and radius of the NS in 4U 1724–307. The new (solid) and the old (dashed) curves corresponding to TEdd,∞ are shown. The dash-dotted curve corresponds to the new best-fit parameter A for the distance to the source of 5.3 kpc.
Current usage metrics show cumulative count of Article Views (full-text article views including HTML views, PDF and ePub downloads, according to the available data) and Abstracts Views on Vision4Press platform.
Data correspond to usage on the plateform after 2015. The current usage metrics is available 48-96 hours after online publication and is updated daily on week days.
Initial download of the metrics may take a while.