Fig. 1
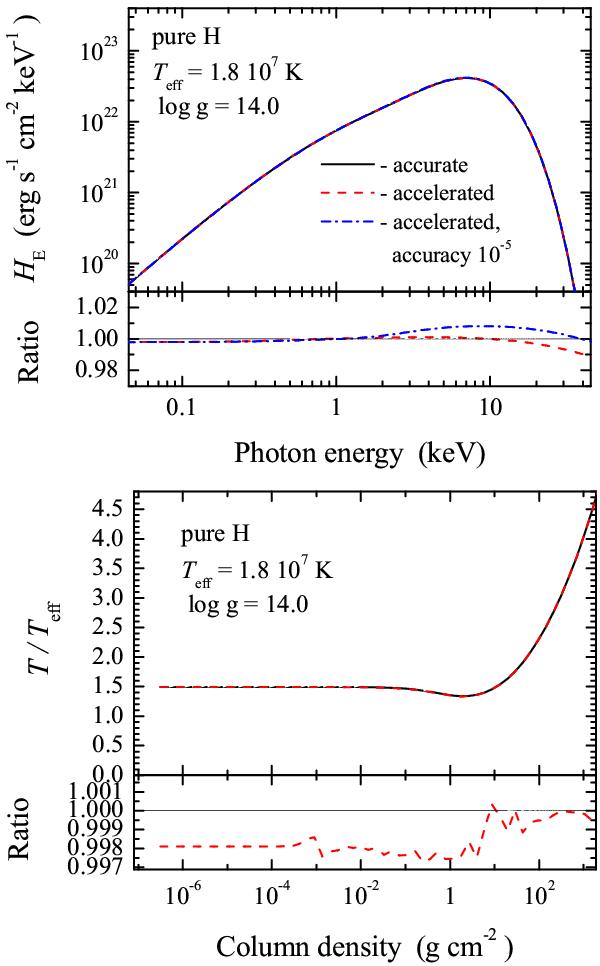
Emergent spectrum (top panel) and temperature structure (bottom panel) of the fiducial model (pure hydrogen, Teff = 1.8 × 10⁷ K, log g = 14.0) computed using three different methods. In accurate method 1 every Λ-iteration starts from the thermal part of the source function (solid curves give the results for the relative accuracy of 10-4). In accelerated method 2, the Λ-iterations start from the source function taken from previous temperature iteration, but at every fifth temperature correction they start from the thermal part of the source function (dashed curves show results for the relative accuracy of 10-4). Method 3 is the same as method 2, but for the relative accuracy of 10-5 (dot-dashed curve). In the top lower panel, the ratios of the spectra for methods 2 and 3 to the spectrum computed with method 1 are shown. The ratio of the temperature structures computed using methods 2 and 1 is shown in the bottom lower panel.
Current usage metrics show cumulative count of Article Views (full-text article views including HTML views, PDF and ePub downloads, according to the available data) and Abstracts Views on Vision4Press platform.
Data correspond to usage on the plateform after 2015. The current usage metrics is available 48-96 hours after online publication and is updated daily on week days.
Initial download of the metrics may take a while.