Fig. 8
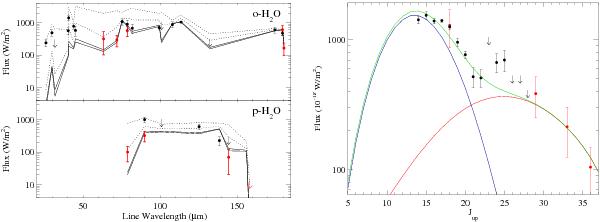
All the available ISO (black points) and Herschel (red points) observations of H2O (left panel) and CO (right panel) lines for T Tau are shown. Left panel: line fluxes predicted by a slow C-shock for an emitting area of ~360 AU diameter and pre-shock density of n = 106 cm-3 (velocity V = 20−30 km s-1, solid lines), or n = 107 cm-3 (V = 10−20 km s-1, dotted lines). The low-excitation water lines are well reproduced by C-shock with pre-shock density of 106 cm-3 while the higher excitation lines require higher pre-shock density. Right panel: CO line fluxes predicted by: a C-shock model (n = 106 cm-3, V = 20−30 km s-1, emitting area diameter, D = 360 AU, red line); an LVG warm gas component (n = 106, T = 300 K, D = 360 AU, NCO = 1.5 × 1018 cm-2, blue line); the sum of the two models (green line). While the high-J CO lines are well reproduced by the same C-shock model used for water lines, a warm gas component is required to simultaneously fit the lower-J lines observed with ISO (down to Jup = 14).
Current usage metrics show cumulative count of Article Views (full-text article views including HTML views, PDF and ePub downloads, according to the available data) and Abstracts Views on Vision4Press platform.
Data correspond to usage on the plateform after 2015. The current usage metrics is available 48-96 hours after online publication and is updated daily on week days.
Initial download of the metrics may take a while.