Fig. 6
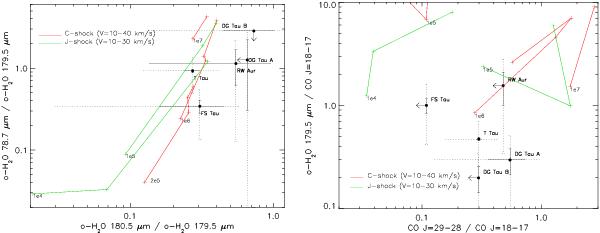
Observed H2O and CO line ratios (black dots) are compared with the predictions of slow C-type (red lines) and J-type (green lines) shock models (Flower & Pineau Des Forêts 2010). The solid lines indicate the errors due to the line signal-to-noise, while the dashed lines indicate the total error, obtained by adding the 30% error in the PACS flux calibration. The crosses along the red and green curves correspond to increasing shock velocity, from 10 km s-1 to 40 km s-1 (C-type shocks) or from 10 km s-1 to 30 km s-1 (J-type shocks). At the lowest velocity (Vshock = 10 km s-1), the pre-shock density is given.
Current usage metrics show cumulative count of Article Views (full-text article views including HTML views, PDF and ePub downloads, according to the available data) and Abstracts Views on Vision4Press platform.
Data correspond to usage on the plateform after 2015. The current usage metrics is available 48-96 hours after online publication and is updated daily on week days.
Initial download of the metrics may take a while.