Fig. 4
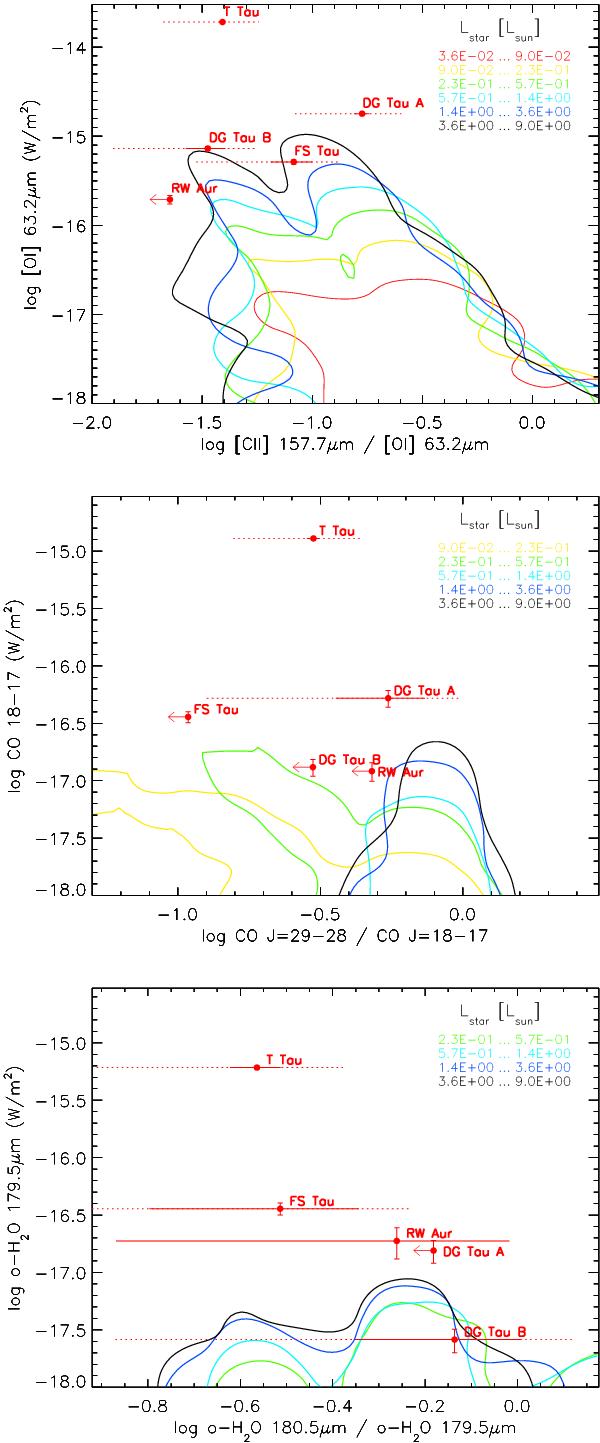
Observed [O i], [C ii], CO, and H2O line fluxes and ratios (red dots) are compared with predictions from a subsample of disk models from the DENT grid (Woitke et al. 2010; Kamp et al. 2011). Contours encircle 85% of the DENT disks for star luminosity values from 10-2 L⊙ to 9 L⊙ (red, yellow, green, cyan, blue, and black contours). The total errors on the observed values (dotted red lines) are obtained summing the error due to the line signal-to-noise (solid red lines) and the 30% error affecting PACS flux calibration. The subsample of disk models is obtained by selecting M ≤ 2.5 M⊙, Teff ≤ 5500 K, L ≤ 9 L⊙, Rin = Rsubl, and dust-to-gas ratio =0.01.

Current usage metrics show cumulative count of Article Views (full-text article views including HTML views, PDF and ePub downloads, according to the available data) and Abstracts Views on Vision4Press platform.
Data correspond to usage on the plateform after 2015. The current usage metrics is available 48-96 hours after online publication and is updated daily on week days.
Initial download of the metrics may take a while.