Fig. 3
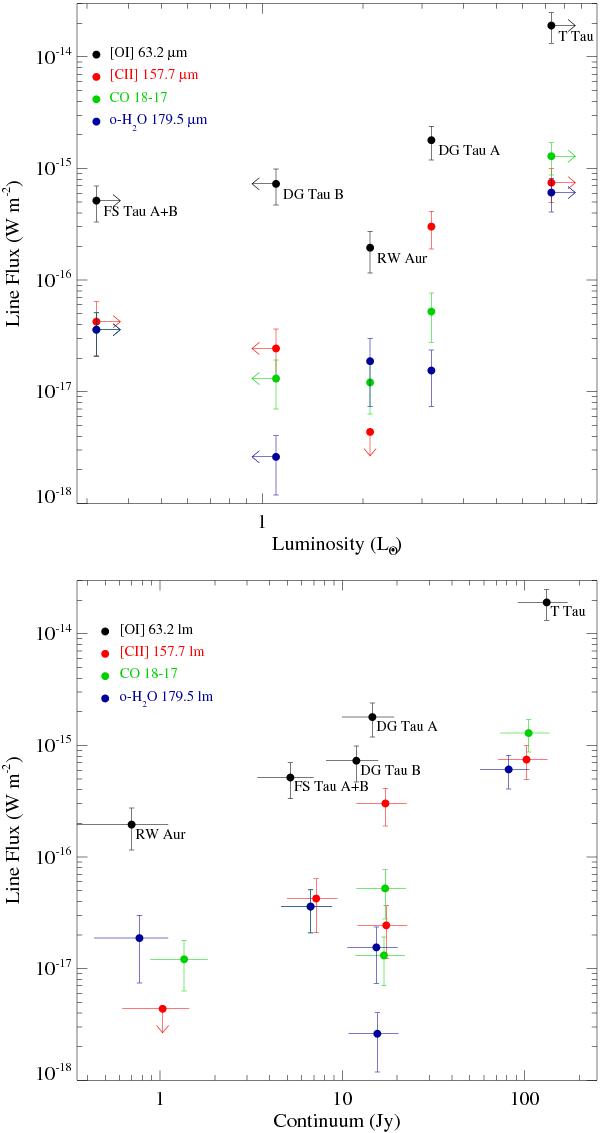
The fluxes of the [O i] 63 μm, the [C ii] 158 μm, the CO J = 18−17, and the o-H2O 179.5 μm lines are plotted versus the source luminosity (upper panel) and their adjacent continuum (lower panel) for all the sources in our sample (black, red, green, and blue dots). For FS Tau A+B and T Tau N+S the plotted source luminosity is a lower limit, since L ∗ of the Class I components FS Tau B and T Tau S is unknown. The upper limit on the stellar luminosity for DG Tau B corresponds to its bolometric luminosity as estimated by Kruger et al. (2011).
Current usage metrics show cumulative count of Article Views (full-text article views including HTML views, PDF and ePub downloads, according to the available data) and Abstracts Views on Vision4Press platform.
Data correspond to usage on the plateform after 2015. The current usage metrics is available 48-96 hours after online publication and is updated daily on week days.
Initial download of the metrics may take a while.