Fig. 2
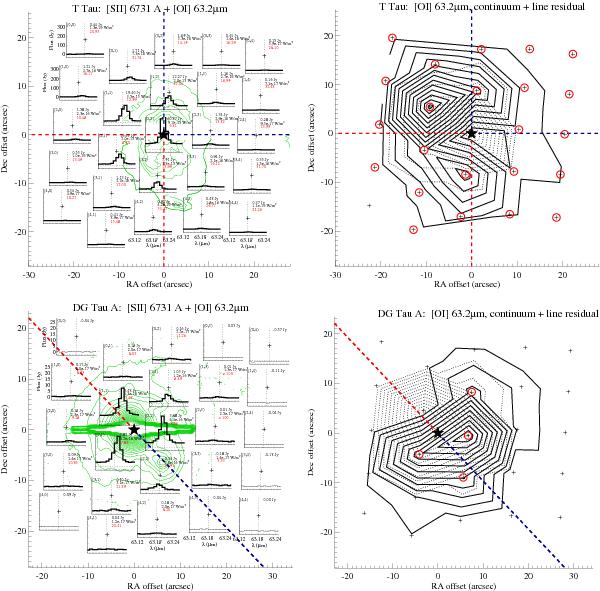
Left panel: [O i] 63 μm line spectra in the 25 spaxels of the PACS array. Each spaxel is labelled by its (x,y) index and its position is indicated by a black cross. The RA and Declination offsets with respect to the source (in arcseconds) are indicated on the x and y axis. The black star is the source position and the blue/red dashed lines the position angle of the optical-jet blue/red lobe. In each spectrum, vertical and horizontal dotted lines show the line wavelength and the zero flux level, respectively. In those spaxels where the line is detected above the 3σ level, the spectrum is drawn with a black thick line, and the estimated continuum level (in Jy), line flux (in W m-2), and line-to-continuum ratio (in red) are indicated. Where the line is not detected only the estimated continuum level (in Jy) is given. The optical-jet emission in the [S ii]λλ 6716, 6731 Å forbidden lines is overplotted (green contours). Contours are from Solf & Böhm (1999) (T Tau), Eislöffel & Mundt (1998) (DG Tau A, DG Tau B, FS Tau A+B), and Dougados et al. (2000) (RW Aur). Right panel: contour levels of continuum (dotted lines) and line residual (solid lines) emission obtained from the analysis in Appendix B. The spaxels where residual line emission is detected with a confidence level ≥ 5 are highlighted by a red circle (for RW Aur the red circles indicate residual emission above the 2σ level). The contours indicate that the line emission is shifted and/or more extended with respect to the continuum emission along the optical jet PA.


Current usage metrics show cumulative count of Article Views (full-text article views including HTML views, PDF and ePub downloads, according to the available data) and Abstracts Views on Vision4Press platform.
Data correspond to usage on the plateform after 2015. The current usage metrics is available 48-96 hours after online publication and is updated daily on week days.
Initial download of the metrics may take a while.