Free Access
Fig. 1
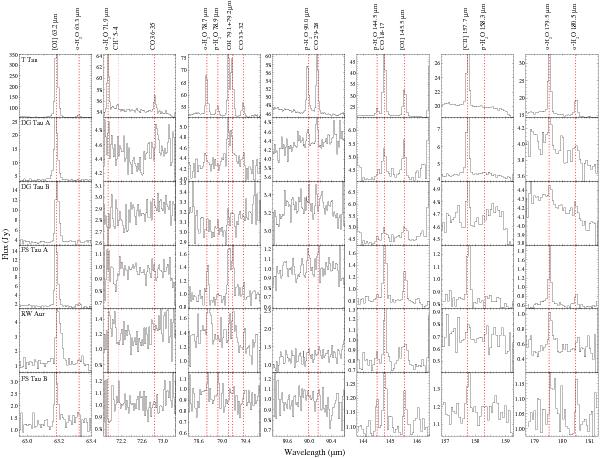
Spectral ranges covered by the Herschel/PACS observations for all of the sources in the sample. The wavelengths of the targeted atomic ([O i], [C ii]) and molecular (H2O, OH, CO) lines are shown by the vertical dotted red lines.
Current usage metrics show cumulative count of Article Views (full-text article views including HTML views, PDF and ePub downloads, according to the available data) and Abstracts Views on Vision4Press platform.
Data correspond to usage on the plateform after 2015. The current usage metrics is available 48-96 hours after online publication and is updated daily on week days.
Initial download of the metrics may take a while.