Fig. 9
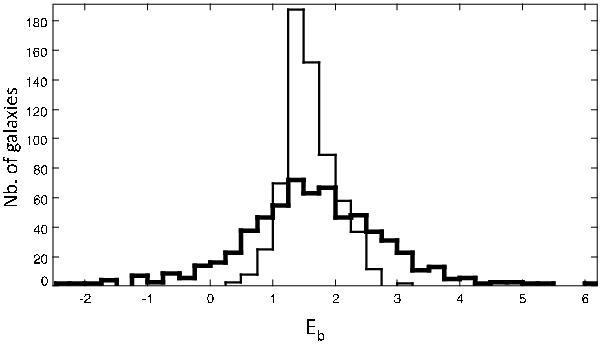
Distribution of Eb. Thin line: Eb estimated as the mean of the PDF. Thick line: Eb values corrected for edge effects (see text for details). The regressions used for the corrections are: Eb(SEDfitting) = 0.26Eb(model) + 1.08, Eb(SEDfitting) = 0.47Eb(model) + 0.91, and Eb(SEDfitting) = 0.56Eb(model) + 0.74 for the samples without IR detection, with MIPS detections only, and with MIPS and PACS detections, respectvely.
Current usage metrics show cumulative count of Article Views (full-text article views including HTML views, PDF and ePub downloads, according to the available data) and Abstracts Views on Vision4Press platform.
Data correspond to usage on the plateform after 2015. The current usage metrics is available 48-96 hours after online publication and is updated daily on week days.
Initial download of the metrics may take a while.