Free Access
Fig. 5
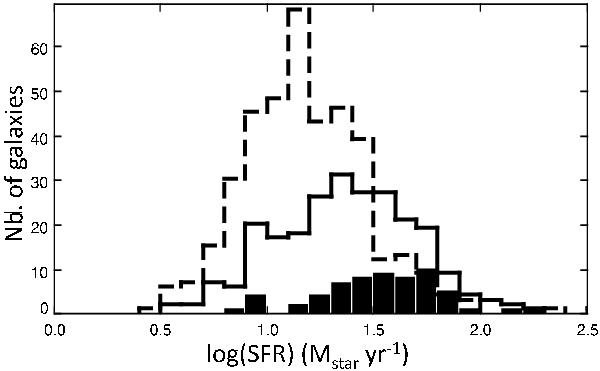
Histogram of the distribution of the SFR obtained with SED fitting. The distribution with a dashed line corresponds to galaxies without IR detection, the solid line to galaxies detected by MIPS, and the filled histogram is obtained for galaxies detected by PACS.
Current usage metrics show cumulative count of Article Views (full-text article views including HTML views, PDF and ePub downloads, according to the available data) and Abstracts Views on Vision4Press platform.
Data correspond to usage on the plateform after 2015. The current usage metrics is available 48-96 hours after online publication and is updated daily on week days.
Initial download of the metrics may take a while.