Fig. 4
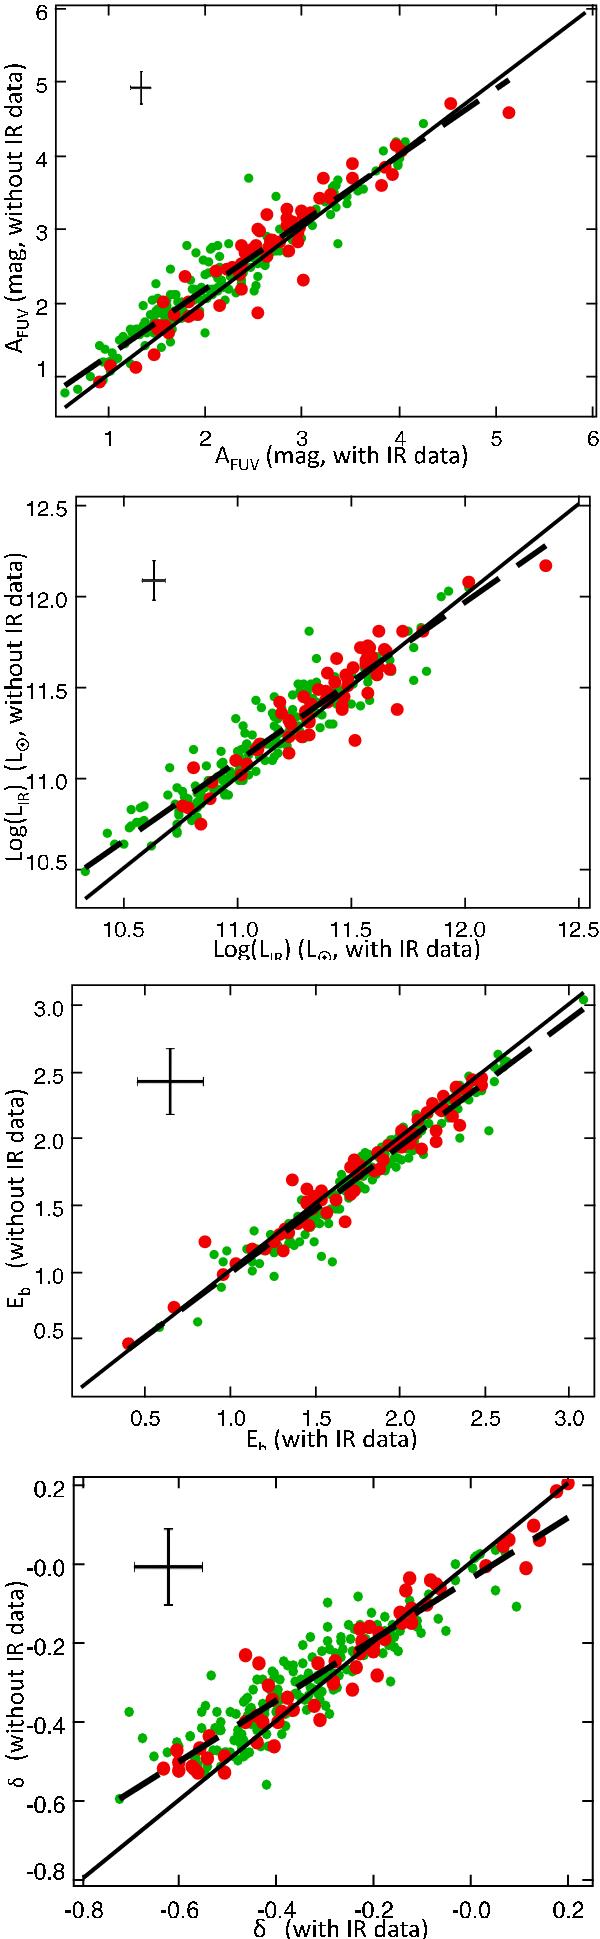
Parameters estimated with available IR data (x-axis) are compared to those estimated without any IR data. Galaxies with only MIPS data are plotted with small green symbols, galaxies with MIPS and PACS detection with large red symbols. The green dashed line is the result of the linear regression and the black solid line is the 1:1 relation. Typical error bars (1σ) are plotted on the left corner of each plot.
Current usage metrics show cumulative count of Article Views (full-text article views including HTML views, PDF and ePub downloads, according to the available data) and Abstracts Views on Vision4Press platform.
Data correspond to usage on the plateform after 2015. The current usage metrics is available 48-96 hours after online publication and is updated daily on week days.
Initial download of the metrics may take a while.