Fig. 7
Download original image
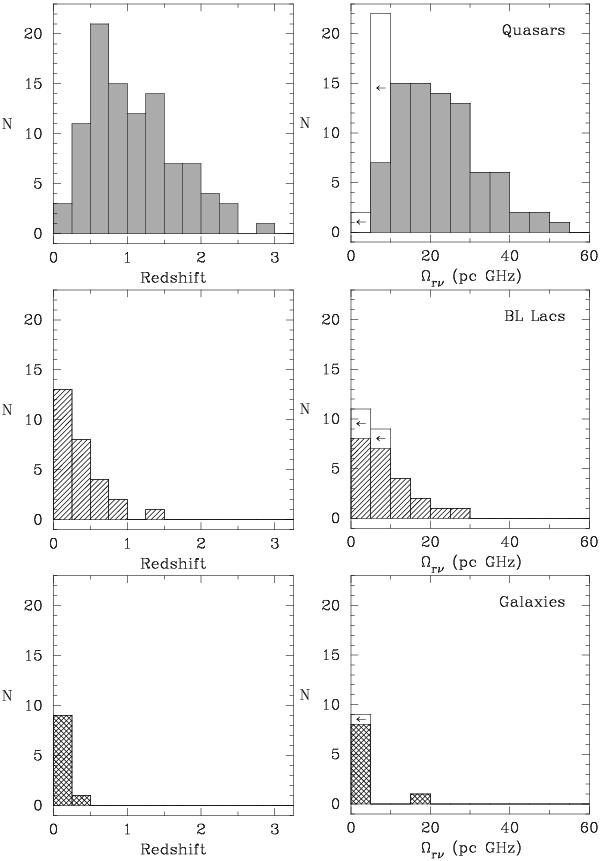
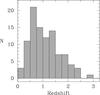
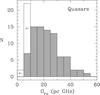
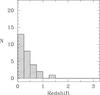
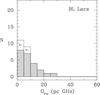
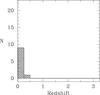
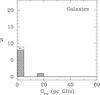
Distribution of redshift (left) and core shift measure Ωrν (right) for 136 sources with the core shift derived between 15 and 8 GHz. Gray filled bins represent 98 quasars (top), dashed bins represent 28 BL Lacs (middle), and cross-hatched bins represent 10 galaxies (bottom). Empty bins show upper limits.
Current usage metrics show cumulative count of Article Views (full-text article views including HTML views, PDF and ePub downloads, according to the available data) and Abstracts Views on Vision4Press platform.
Data correspond to usage on the plateform after 2015. The current usage metrics is available 48-96 hours after online publication and is updated daily on week days.
Initial download of the metrics may take a while.