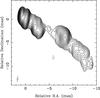
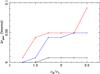
Fig. 6
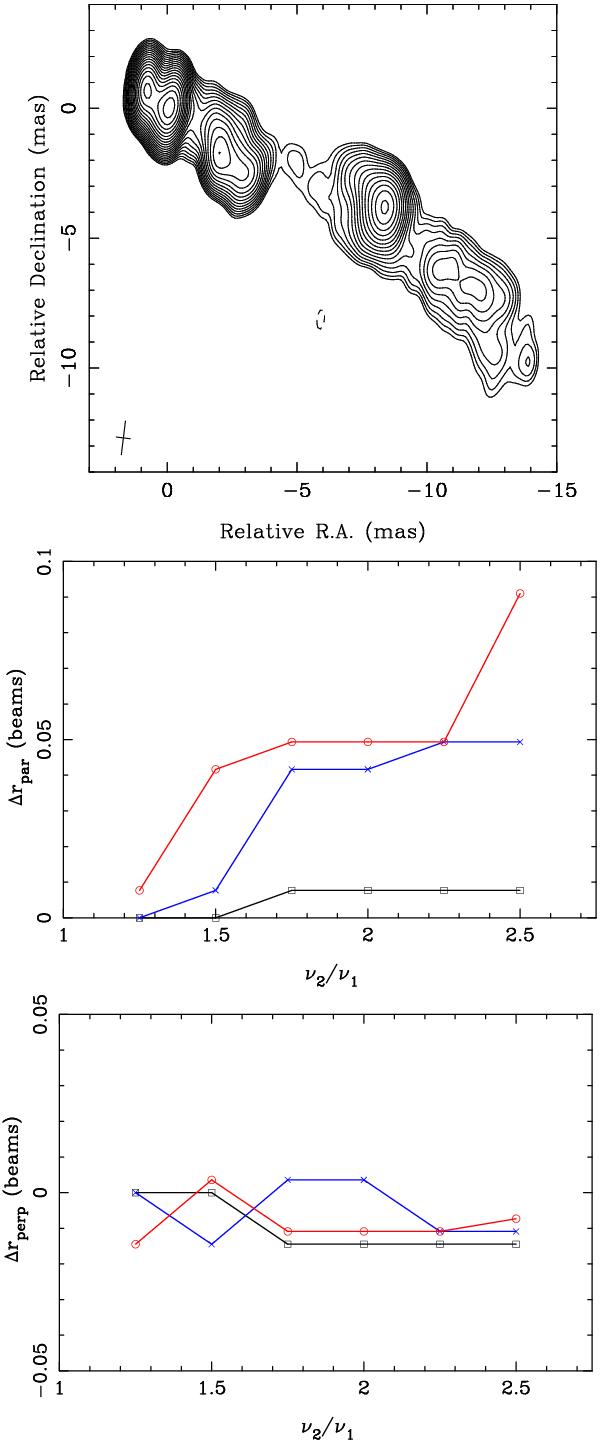
Download original image
Naturally weighted total intensity CLEAN image of 3C 273 at 15.4 GHz (top). The alignment error (in beam widths) along the jet as a function of frequency ratio (middle). The alignment error (in beam widths) perpendicular to the jet (bottom). The error is defined as rν1−rν2 where rν1 is the position in the low-frequency image and rν2 is the corresponding position in the high-frequency image. The different spectral index gradients are shown in different colors: −0.1 mas-1 (black squares), −0.2 mas-1 (blue crosses), and −0.3 mas-1 (red circles).
Current usage metrics show cumulative count of Article Views (full-text article views including HTML views, PDF and ePub downloads, according to the available data) and Abstracts Views on Vision4Press platform.
Data correspond to usage on the plateform after 2015. The current usage metrics is available 48-96 hours after online publication and is updated daily on week days.
Initial download of the metrics may take a while.