Fig. 5
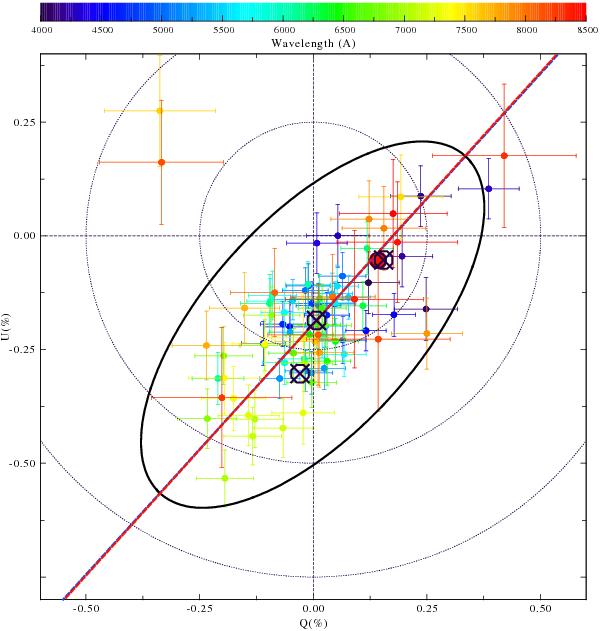
Combined spectropolarimetry of SN 2005ke (November 16 and 17, 2005). The large filled circle marks the ISP estimated from the late-time data (see Sect. 4.1), while the circled crosses indicate B, A and C ISP estimates (from right to left respectively; see Table 2). The dashed line traces the best fit dominant axis, while the ellipse indicates the axial ratio and orientation of the data (see Sect. 4.2). For presentation, the size of the ellipse was arbitrarily scaled. The dotted circles indicate polarization levels of 0.25, 0.50 and 0.75%.
Current usage metrics show cumulative count of Article Views (full-text article views including HTML views, PDF and ePub downloads, according to the available data) and Abstracts Views on Vision4Press platform.
Data correspond to usage on the plateform after 2015. The current usage metrics is available 48-96 hours after online publication and is updated daily on week days.
Initial download of the metrics may take a while.