Fig. 1
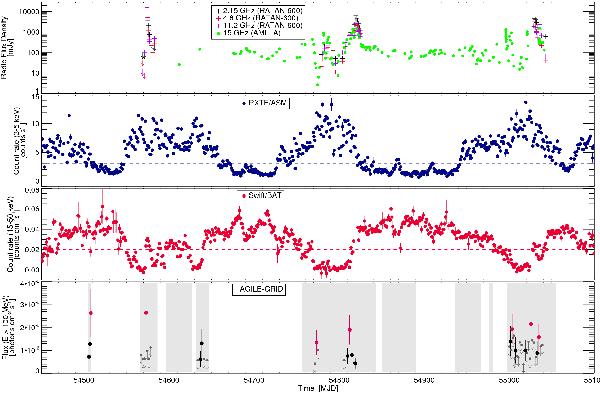
Multi-frequency light curve of Cygnus X-3 from 2007 December 12 to 2009 September 26 (MJD: 54 450−55 100). From top to bottom: radio flux density [RATAN-600 (2.15, 4.8, 11.2 GHz) and AMI-LA (15 GHz)], soft X-ray count rate [RXTE/ASM (3−5 keV)], hard X-ray count rate [Swift/BAT (15−50 keV)], and gamma-ray photon fluxes [AGILE-GRID (above 100 MeV)]. In the bottom panel, gray regions represent the AGILE pointing at the Cygnus region; magenta points are the main events of γ-ray activity with  (see Table A.1), black points are the γ-ray detections with
  , and dark-gray arrows are the 2σ upper limits related to
  . The dashed lines in the panels of the RXTE/ASM and Swift/BAT count rate represent the transition level of 3 counts s-1 and 0.02 counts cm-2 s-1 respectively (see Sect. 3.1 for details).
Current usage metrics show cumulative count of Article Views (full-text article views including HTML views, PDF and ePub downloads, according to the available data) and Abstracts Views on Vision4Press platform.
Data correspond to usage on the plateform after 2015. The current usage metrics is available 48-96 hours after online publication and is updated daily on week days.
Initial download of the metrics may take a while.