Fig. 1
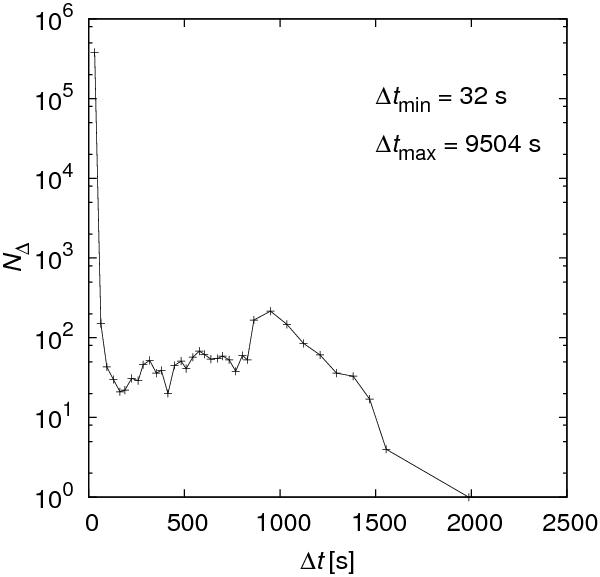
Histogram of the sampling intervals in the V1149 Aql data set. The number of sampling intervals, NΔ, of a given value, Δt, is plotted only up to Δt = 2000 s; the maximal sampling interval is a huge gap of Δtmax = 9504 s. The minimal sampling interval Δtmin = 32 s corresponds to the nominal observation mode.
Current usage metrics show cumulative count of Article Views (full-text article views including HTML views, PDF and ePub downloads, according to the available data) and Abstracts Views on Vision4Press platform.
Data correspond to usage on the plateform after 2015. The current usage metrics is available 48-96 hours after online publication and is updated daily on week days.
Initial download of the metrics may take a while.