Fig. 9
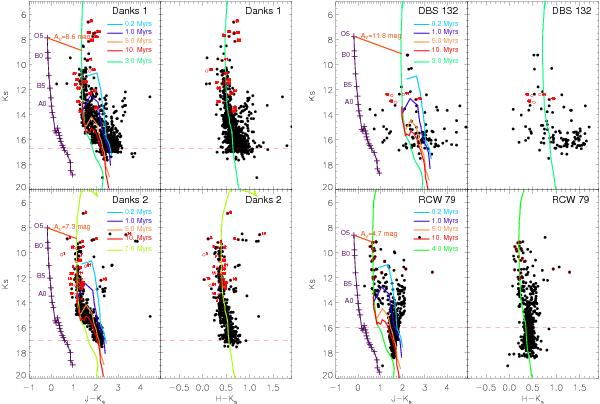
The colour − magnitude diagrams for the four studied clusters. The Schmidt-Kaler (1982) sequence is shown in the (J − Ks) vs. Ks diagram. Red circles mark the stars for which spectra have been observed, and the number attached to them refers to the name of the star listed in Table 2. The red dashed lines represent 50% completeness limit. The green line is the main-sequence model (the exact colour changes with the age used), whereas the others (light blue, dark blue, orange and read) are PMS models. See text for more details.
Current usage metrics show cumulative count of Article Views (full-text article views including HTML views, PDF and ePub downloads, according to the available data) and Abstracts Views on Vision4Press platform.
Data correspond to usage on the plateform after 2015. The current usage metrics is available 48-96 hours after online publication and is updated daily on week days.
Initial download of the metrics may take a while.