Fig. 7
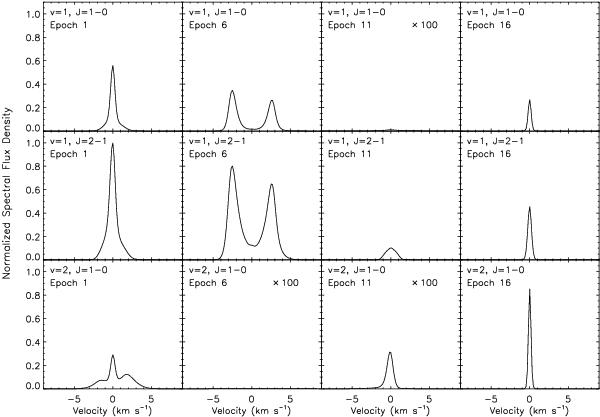
Calculated spectra for SiO masers of v = 1,J = 1−0,2−1 and v = 2,J = 1−0 transitions. The scale of flux density has been normalized to that of the peak value of the v = 1,J = 2−1 SiO maser at epoch 1. In panels with “ × 100”, this notation indicates that the intensity is multiplied by a factor of 100, in order to show this information clearly.
Current usage metrics show cumulative count of Article Views (full-text article views including HTML views, PDF and ePub downloads, according to the available data) and Abstracts Views on Vision4Press platform.
Data correspond to usage on the plateform after 2015. The current usage metrics is available 48-96 hours after online publication and is updated daily on week days.
Initial download of the metrics may take a while.