Fig. 8
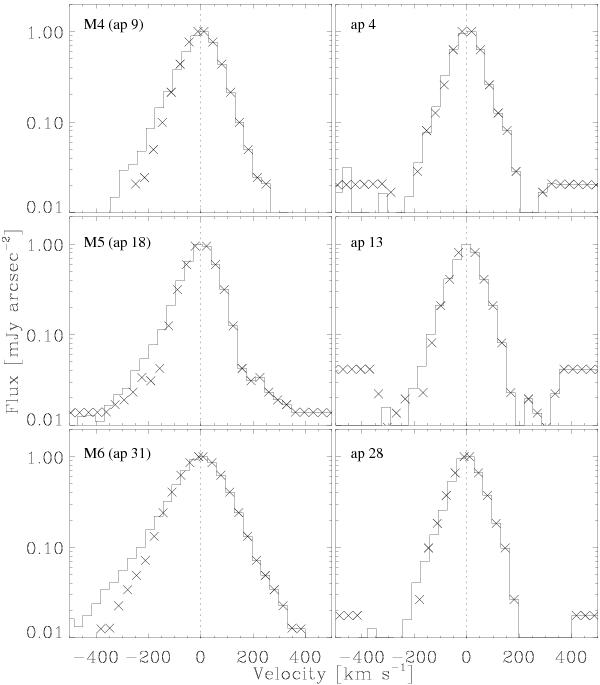
Shape of the Brγ line. Top to bottom, left to right: apertures 9 (M4), 18 (M5), 31 (M6), 4, 13 and 28. The null velocity is chosen as the centre of the Gaussian fit of the line, and the continuum derived in the fit is subtracted. The crosses show the actual profile values for the positive velocities, which are also plotted for the negative velocities to show the asymmetry of the profile.
Current usage metrics show cumulative count of Article Views (full-text article views including HTML views, PDF and ePub downloads, according to the available data) and Abstracts Views on Vision4Press platform.
Data correspond to usage on the plateform after 2015. The current usage metrics is available 48-96 hours after online publication and is updated daily on week days.
Initial download of the metrics may take a while.