Fig. 6
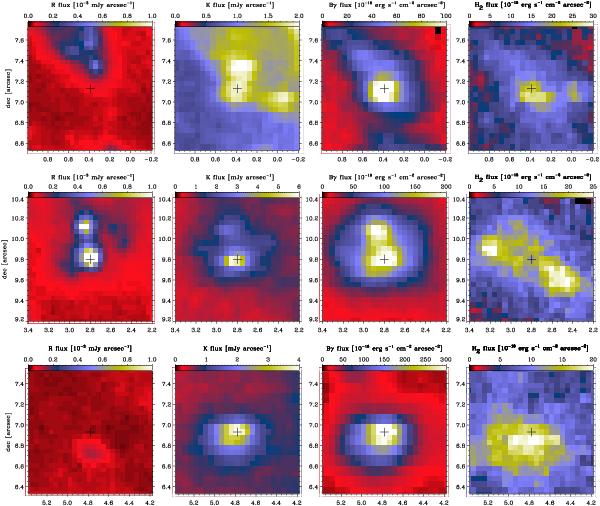
Zooms on the 1.2 × 1.2′′2 around M4 (first row), M5 (second row) and M6 (third row). For each source, from left to right we display the R-band image (HST), the K-band image emission, the Brγ emission and the H2 1–0S(1) emission. The crosses mark the position of the Brγ peak. North is up and east is left, and the X and Y axis are in arcsec.
Current usage metrics show cumulative count of Article Views (full-text article views including HTML views, PDF and ePub downloads, according to the available data) and Abstracts Views on Vision4Press platform.
Data correspond to usage on the plateform after 2015. The current usage metrics is available 48-96 hours after online publication and is updated daily on week days.
Initial download of the metrics may take a while.