Fig. 3
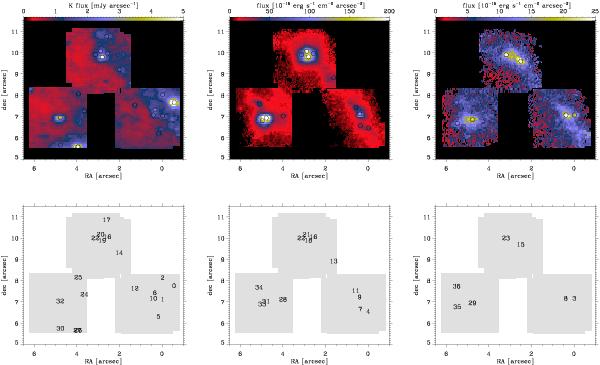
Top row, left to right: reconstructed maps for K-band flux density, Brγ flux and H2 1–0 S(1) flux. The chosen apertures are drawn on the maps. The aperture labels are given for each map on the empty map below it for clarity. The label number is given in increasing Right Ascension. North is up and east is left, and the X and Y axes are in arcsec.
Current usage metrics show cumulative count of Article Views (full-text article views including HTML views, PDF and ePub downloads, according to the available data) and Abstracts Views on Vision4Press platform.
Data correspond to usage on the plateform after 2015. The current usage metrics is available 48-96 hours after online publication and is updated daily on week days.
Initial download of the metrics may take a while.