Free Access
Fig. 1
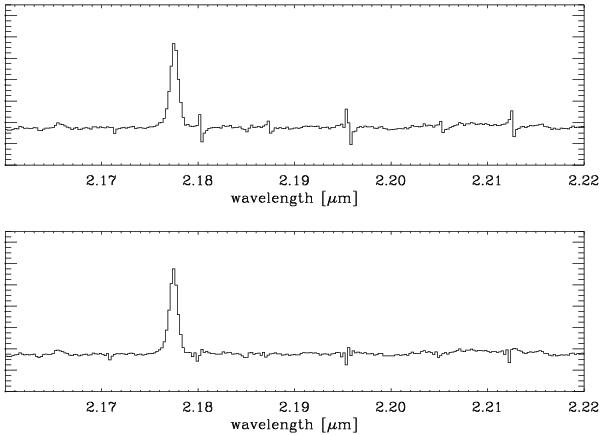
Example of the sky-subtraction correction, for an average case. We display a portion of the 1′′ radius aperture spectrum of one of the M4 data cube pairs. On top, the P-Cygni-like residuals are stronger before correction, and below, after correction, the residuals have been attenuated. The emission line is Brγ.
Current usage metrics show cumulative count of Article Views (full-text article views including HTML views, PDF and ePub downloads, according to the available data) and Abstracts Views on Vision4Press platform.
Data correspond to usage on the plateform after 2015. The current usage metrics is available 48-96 hours after online publication and is updated daily on week days.
Initial download of the metrics may take a while.