Fig. 5
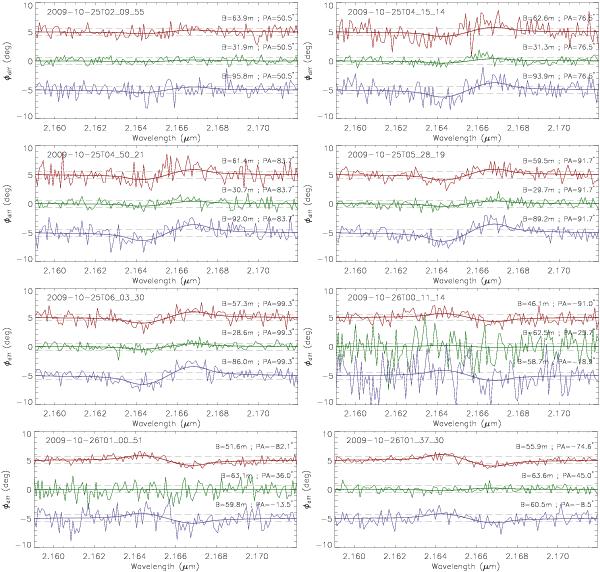
The 84 VLTI/AMBER φdiff(λ) measured on Achernar around Br γ at 28 different observing times (format YYYY-MM-DDTHH_MM_SS) and, for each time, three different projected baselines and baseline position angles, as indicated in the plots. The dashed gray horizontal lines indicate the median ±σφ = ±0.6° of all observations. The smooth curves superposed to the observations are the best-fit φdiff obtained with a uniform-rotation, gravity-darkened Roche model, as described in Sect. 4. All the observed φdiff points are shown here, even if the fit has been performed using only each third wavelength point (cf. Sect. 4). All φdiff curves are equal to zero in the continuum, but they were shifted for better readability. The other panels are available in the electronic edition.
Current usage metrics show cumulative count of Article Views (full-text article views including HTML views, PDF and ePub downloads, according to the available data) and Abstracts Views on Vision4Press platform.
Data correspond to usage on the plateform after 2015. The current usage metrics is available 48-96 hours after online publication and is updated daily on week days.
Initial download of the metrics may take a while.