Fig. 1
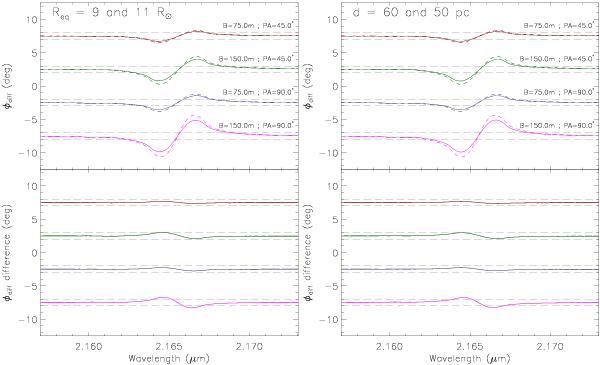
Top: dependence of simulated differential phases φdiff on Req and on d (solid line: tested model; dashed line: reference model as described in Sect. 2). The parameters of the tested model are identical to those of the reference model, except that Req = 9 R⊙ (left) and d = 60 pc (right). The values of the tested and reference models differ by ≃20%; they are indicated in the upper left part of the figures. All φdiff models were calculated across the Br γ line with a spectral resolution of 12 000 at four projected baselines (Bproj = 75 m and 150 m, and PA = 45° and 90°), which are typical values attained with VLTI/AMBER. These wavelengths and baselines result in visibility amplitudes between 0.6 and 0.9 for the studied stellar models, corresponding to a partially resolved star. The horizontal dashed gray lines indicate the typical error bar of AMBER φdiff (σφ = ± 0.5°). The φdiff signature of stellar rotation appears as an s-shaped curve well visible inside Br γ, with an amplitude higher than σφ at all baselines. Bottom: difference between φdiff of the tested and reference models (solid minus dashed curves in the top panel). The continuum of all curves is equal to zero, but they were shifted for better readability.
Current usage metrics show cumulative count of Article Views (full-text article views including HTML views, PDF and ePub downloads, according to the available data) and Abstracts Views on Vision4Press platform.
Data correspond to usage on the plateform after 2015. The current usage metrics is available 48-96 hours after online publication and is updated daily on week days.
Initial download of the metrics may take a while.