Fig. 2
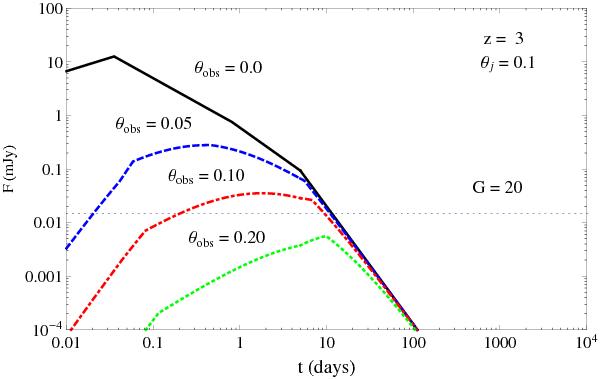
Example of afterglow light curve at z = 3 as a function of observed angle, θobs. We show the evolution of afterglow flux F(mJy) as a function of time t (days) and observed angle θobs for typical parameters: isotropic kinetic energy Eiso = 1054 erg, electron spectral index p = 2.5, plasma parameters ϵe = 0.1, ϵB = 0.01, half-opening angle jet θj = 0.1, interstellar medium density n = 1 cm-3 and frequency ν = 5 × 10¹⁴ Hz. The horizontal dotted line is the integrated Gaia flux limit; solid black line, θobs = 0; dashed blue line, θobs = 0.05; dot-dashed red line, θobs = 0.1; dotted green line, θobs = 0.20.
Current usage metrics show cumulative count of Article Views (full-text article views including HTML views, PDF and ePub downloads, according to the available data) and Abstracts Views on Vision4Press platform.
Data correspond to usage on the plateform after 2015. The current usage metrics is available 48-96 hours after online publication and is updated daily on week days.
Initial download of the metrics may take a while.