Free Access
Fig. 4
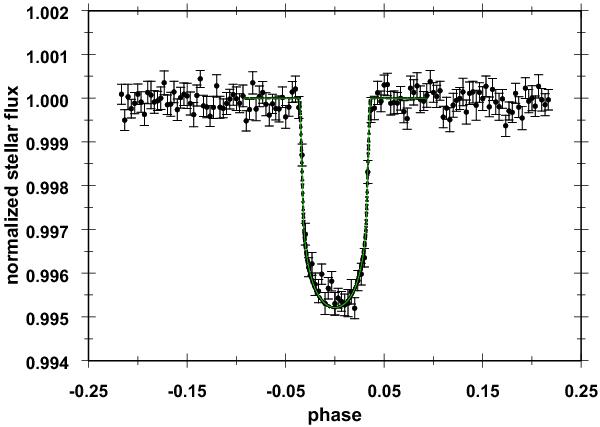
Phase diagram of the raw light curve from −0.25 to +0.25 in phase. The phase has been divided into 300 bins with average flux and standard deviation shown for each bin. The solid line is the fit as described in the text. Fit results are given in Table 1.
Current usage metrics show cumulative count of Article Views (full-text article views including HTML views, PDF and ePub downloads, according to the available data) and Abstracts Views on Vision4Press platform.
Data correspond to usage on the plateform after 2015. The current usage metrics is available 48-96 hours after online publication and is updated daily on week days.
Initial download of the metrics may take a while.