Fig. 1
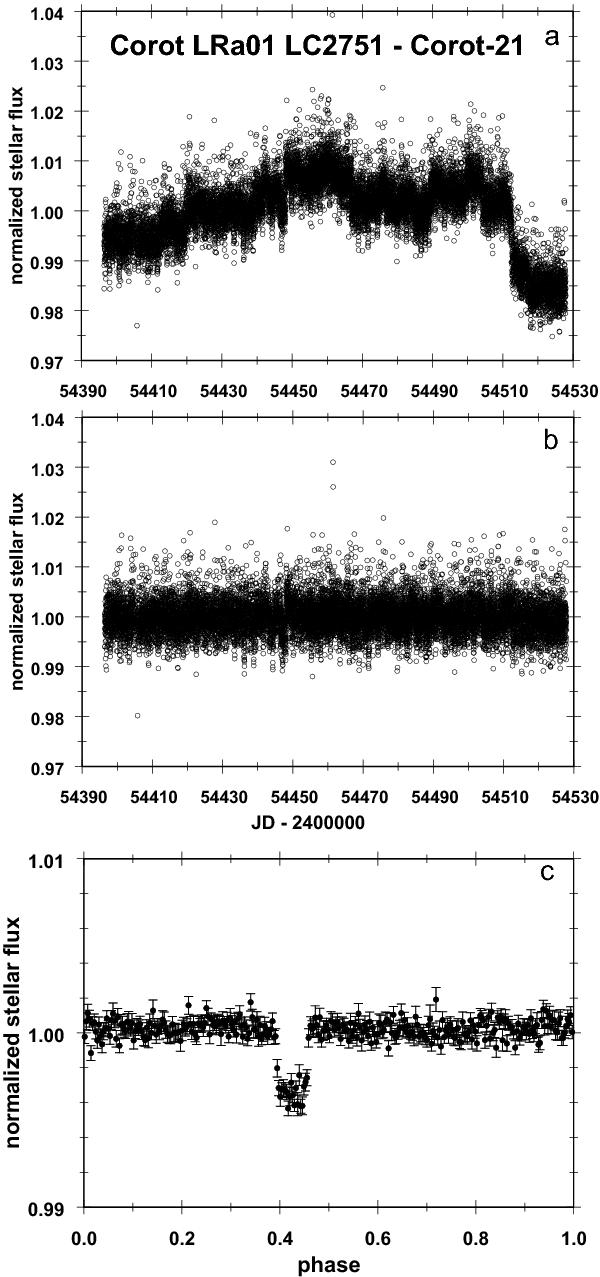
a) Normalized raw light curve of CoRoT-21 during the observation time from MJD 54 396 to MJD 54 529. Strong variations in stellar flux are obvious. b) Light curve after removing a common trend as computed from a subset of 200 light curves and after harmonic filtering. c) Phase diagram of the trend-filtered light curve at period 2.7472 days. The phase is divided into 300 bins with mean flux and standard deviation displayed for each bin.
Current usage metrics show cumulative count of Article Views (full-text article views including HTML views, PDF and ePub downloads, according to the available data) and Abstracts Views on Vision4Press platform.
Data correspond to usage on the plateform after 2015. The current usage metrics is available 48-96 hours after online publication and is updated daily on week days.
Initial download of the metrics may take a while.