Fig. 5
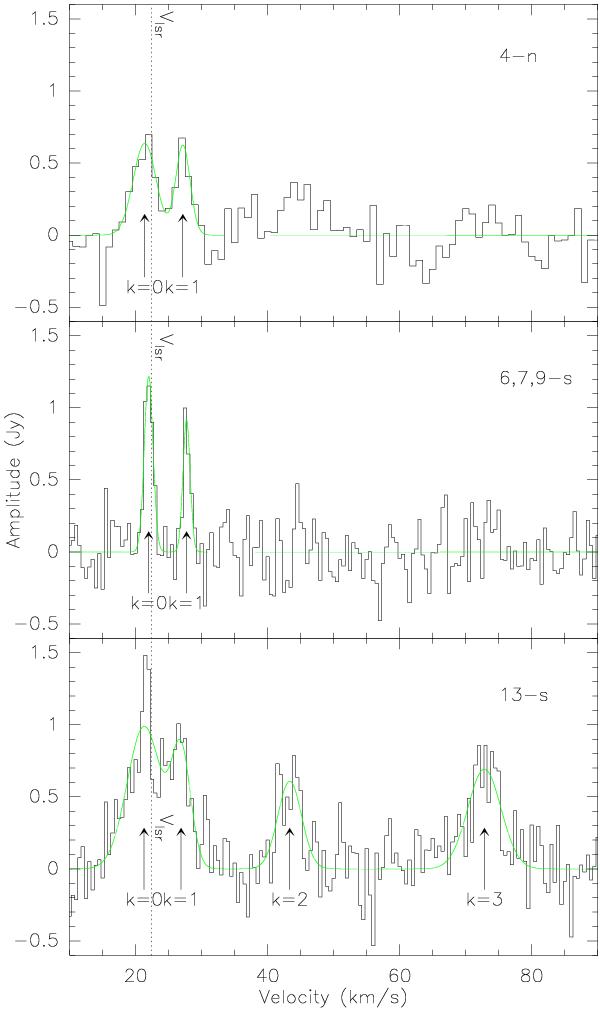
Observed CH3CN spectra towards sources 13-s, 6,7,9-s, and 4-n. The detected K-components are marked with arrows in each case, and the rest velocity with a dotted line. The green solid line is the best Gaussian fit for the lines, obtained with CLASS, and the resulting line parameters are in Table 4. Only for 13-s were the four K-components detected, indicating a warmer environment.
Current usage metrics show cumulative count of Article Views (full-text article views including HTML views, PDF and ePub downloads, according to the available data) and Abstracts Views on Vision4Press platform.
Data correspond to usage on the plateform after 2015. The current usage metrics is available 48-96 hours after online publication and is updated daily on week days.
Initial download of the metrics may take a while.