Fig. 1
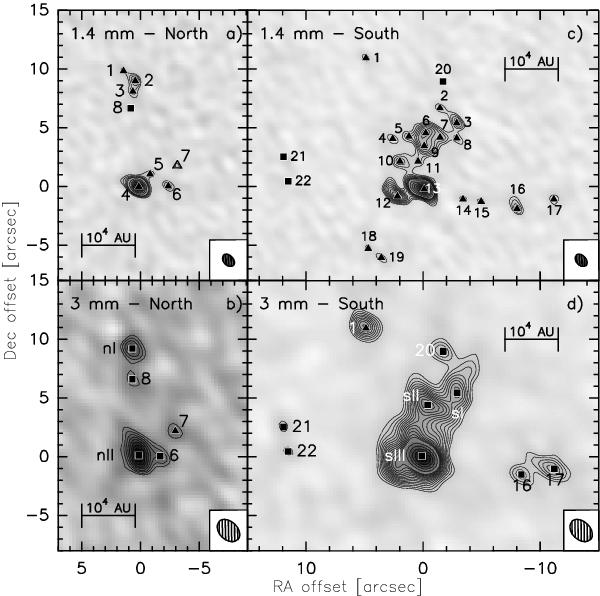
Continuum maps of IRAS 19410+2336 obtained with the PdBI. In the top row are the 1.4 mm maps of the northern (panel a)) and southern (panel c)) (proto)clusters. Similarly, in the bottom row are the 3 mm maps of the northern and southern (proto)clusters in panels b) and d), respectively. The contouring starts at the 4σ level in all the panels. Contours in panel a) increase in 1σ steps up to 8σ and in 4σ steps afterwards, in panel b) in 4σ steps, in panel c) in 1σ steps up to 11σ, and in 4σ steps afterwards, and in panel d) in 1σ steps up to 16σ and in 4σ steps afterwards. See Table 2 for the σ values. The triangles mark the position of the sources detected at 1.4 mm, while the squares are the sources detected at 3 mm. A square appearing in a 1.4 mm map indicates a source that is only detected at 3 mm. Similarly, a triangle in a 3 mm map signals a source detected at the same position in a 1.4 mm map.
Current usage metrics show cumulative count of Article Views (full-text article views including HTML views, PDF and ePub downloads, according to the available data) and Abstracts Views on Vision4Press platform.
Data correspond to usage on the plateform after 2015. The current usage metrics is available 48-96 hours after online publication and is updated daily on week days.
Initial download of the metrics may take a while.