| Issue |
A&A
Volume 544, August 2012
|
|
|---|---|---|
| Article Number | L5 | |
| Number of page(s) | 6 | |
| Section | Letters | |
| DOI | https://doi.org/10.1051/0004-6361/201219831 | |
| Published online | 31 July 2012 | |
Letter to the Editor
Detection of an asymmetry in the envelope of the carbon Mira R Fornacis using VLTI/MIDI⋆,⋆⋆
1
University of Vienna, Dept. of Astrophysics,
Türkenschanzstrasse
17,
1180
Vienna,
Austria
e-mail: This email address is being protected from spambots. You need JavaScript enabled to view it.
2
Department of Physics and Astronomy, Uppsala
University, Box
516, 75120
Uppsala,
Sweden
3
Max-Planck-Institut für Radioastronomie,
53121
Bonn,
Germany
4
ESO, Karl-Schwarzschild-Str. 2, 85748
Garching bei München,
Germany
5
Institut d’Astronomie et d’Astrophysique, Université Libre de
Bruxelles, CP 226, Boulevard du
Triomphe, 1050
Bruxelles,
Belgium
Received: 17 June 2012
Accepted: 12 July 2012
Abstract
Aims. We present a study of the envelope morphology of the carbon Mira R For with VLTI/MIDI. This object is one of the few asymptotic giant branch (AGB) stars that underwent a dust-obscuration event. The cause of such events is still a matter of discussion. Several symmetric and asymmetric scenarios have been suggested in the literature.
Methods. Mid-infrared interferometric observations were obtained separated by two years. The observations probe different depths of the atmosphere and cover different pulsation phases. The visibilities and the differential phases were interpreted using GEM-FIND, a tool for fitting spectrally dispersed interferometric observations with the help of wavelength-dependent geometric models.
Results. We report the detection of an asymmetric structure revealed through the MIDI differential phase. This asymmetry is observed at the same baseline and position angle two years later. The observations are best simulated with a model that includes a uniform-disc plus a Gaussian envelope plus a point-source. The geometric model can reproduce both the visibilities and the differential phase signatures.
Conclusions. Our MIDI data favour explanations of the R For obscuration event that are based on an asymmetric geometry. We clearly detect a photocentre shift between the star and the strongly resolved dust component. This might be caused by a dust clump or a substellar companion. However, the available observations do not allow us to distinguish between the two options. The finding has strong implications for future studies of the geometry of the envelope of AGB stars: if this is a binary, are all AGB stars that show an obscuration event binaries as well? Or are we looking at asymmetric mass-loss processes (i.e. dusty clumps) in the inner part of a carbon-rich Mira?
Key words: stars: AGB and post-AGB / stars: mass-loss / stars: late-type / stars: carbon / techniques: high angular resolution / techniques: interferometric
Based on observations made with ESO telescopes at La Silla Paranal Observatory under program IDs 080.D-0231 and 084.D0361.
Tables 1–3 and Figs. 1, 3 are only available in electronic form at http://www.aanda.org
© ESO, 2012
1. Introduction
The C-star R For is classified as a Mira variable in the General Catalogue of Variable Stars (Samus et al. 2009). Objects of this variability class show photometric variations with amplitudes larger than 2.5 mag in the V band, and with long periods (>100 days). The light curves of Mira variables are usually described as regular with sinusoidal behaviour. Nevertheless, long-term observations of these objects show erratic drops in their brightness (Barthes et al. 1996, and references therein).
The variability of R For was discussed for the first time by Feast et al. (1984), and later by Le Bertre (1988). Both works concluded that the light curve showed a deep minimum in 1983. This decrease was attributed to an increased dust obscuration, the reason for which is (still) unknown.
Four scenarios were envisaged by Feast et al. (1984) to explain the obscuration event, the first two scenarios were symmetric, and the latter two involved an asymmetric geometry of the envelope. The scenarios involve:
-
1.
the ejection of a spherical shell by the star;
-
2.
enhanced dust-condensation in an already existing spherical shell;
-
3.
an asymmetric dust ejection in a preferential direction (i.e. a disc, or a more complex structure);
-
4.
an asymmetric dust ejection in a random direction.
Le Bertre (1988) and Winters et al. (1994) supported the first two scenarios, which reproduced the photometrical data with dynamic models in spherical symmetry. Advanced 2D and 3D model atmospheres by Woitke & Niccolini (2005) and Freytag & Höfner (2008) predicted the formation of concentrated dust clouds in the inner part of the atmospheres, and a spherical distribution on a large scale. Such a morphology might explain the dust obscuration events. However, up to now those models were not compared with observations. On the other hand, these obscuration events have similarities with those observed for R Coronae Borealis stars (R CrB; Clayton et al. 2012). In the latter case, the third and the fourth scenario would be more likely explanations (Bright et al. 2011; Jeffers et al. 2012). Leao et al. (2007) used VLTI/MIDI to study the circumstellar environment of the R CrB star RY Sgr. This star showed a drop in the J and H light curve similar to the one observed for R For. The observations of RY Sgr showed that the star is surrounded by a single dusty cloud located at ~100 stellar radii (~30 AU). Whitelock et al. (1997) suggested a binary-related effect as an alternative explanation. Exceptionally deep minima in the light curves of single O-rich Miras are not observed, but they are fairly common for symbiotic Miras.
This Letter presents high angular resolution observations in the mid-infrared that allow us to probe the dust-forming region of the nearby AGB star R For. Observations close in time, with different position angles and baseline lengths, the differential phase information, and the comparison with geometric models can help to distinguish possible deviations from a spherical structure. This allows one to confirm or reject the different scenarios suggested in the past. Observations and data reduction procedures are presented in Sect. 2. The study of the morphology by means of geometric models is described in Sect. 3, and is discussed in Sect. 4.
2. Observations and data reduction
To study the morphology of the close circumstellar environment of R For, high angular resolution measurements were acquired in the mid-infrared with the ESO-VLTI/MIDI facility (program IDs 080.D-0231 and 084.D0361, Ohnaka and Sacuto respectively). In Table 1 the 29 visibility points observed for the science target are presented. Twenty-four points out of the original sample turned out to be of good quality. In this work we concentrate on the data marked in Table 1 with (b) and (d): these observations were obtained (within each group) at roughly the same pulsation phase (± 0.03), but they sample different spatial scales of the object. Therefore, these two groups are ideal for studying the morphology of the star. The remaining observations will be presented in a forthcoming publication (Paladini et al., in prep.), where we compare them with dynamic model atmospheres (Mattsson et al. 2010).
The uv coverage dispersed in wavelength used for this work is plotted in Fig. 1. Every observation of R For is paired with the observation of at least one calibrator. The list of calibrators used for the data reduction is given in Table 2. The data were reduced with the standard data reduction pipelines MIDI Interactive Analysis (MIA), and Expert Workstation (EWS) package version 1.7.1 (Köhler 2005; Jaffe 2004). A detailed description of the data quality check and error determination is given in Klotz et al. (2012a).
The derived visibilities (upper panels of Fig. 2) exhibit the typical tilde-shape of N-band interferometric observations of C-stars with a SiC feature present at 11.3 μm (Ohnaka et al. 2007; Sacuto et al. 2011). We recognise a drop in the 8−9 μm region, where the main contributors to the opacity are C2H2 and HCN (Fig. 4). We note that the long baseline visibilities of 2009 are systematically lower than the observations of 2007, indicating a more extended dust shell in 2009. The differential phase is a crucial observable for this work because it carries information about the morphology of the source. This corresponds to the difference in phase between the different spectral channels. The EWS software performs a linear fit to the index of water vapour refraction to clean the phase signal from the atmospheric effects (Jaffe 2004; Tubbs et al. 2004). In R For all differential phases show zero signal, except for those observed with the longest baselines (see lower panels of Fig. 2). The phase information in these observations clearly points to a non-central symmetric structure. Signatures in the differential phase have been reported in the literature for two silicate J-type C-stars: IRAS 18006-3213 by Deroo et al. (2007), and BM Gem by Ohnaka et al. (2008). These objects show silicate emission that probably originates from a circum-binary or a circum-companion disc. Many C-stars are known to show photospheric asymmetries (Ragland et al. 2006; Cruzalebes et al., in prep.), while very few extreme objects depart from spherical morphology in the inner dust shell (e.g. IRC+10216 and CIT6; McCarthy et al. 1980; Weigelt et al. 1998; Monnier et al. 2000; Tuthill et al. 2000; Chandler et al. 2007). To our knowledge this is the first time that MIDI has detected a signature of deviation from central symmetry for a carbon Mira variable through the differential phase.
 |
Fig. 2 The shaded-region show the calibrated visibilities (upper panels) and differential phases (lower panels) versus wavelength for the selected observations of 2007 (left) and 2009 (right). The overplotted lines show the best-fitting model (details in Sect. 3). |
3. Morphological interpretation
The wavelength-dependent geometrical model-fitting tool GEM-FIND (Klotz et al. 2012b) was used to model the interferometric observations obtained at comparable visual phases in 2009 ((d) in Table 1). GEM-FIND is based on the Levenberg-Marquardt least-squares minimisation method and allows the fitting of different centro-symmetric and asymmetric geometric models to the dispersed calibrated visibilities. The fitting is limited to the wavelength range <12.5 μm to avoid any bias that may be caused by the noise that usually affects MIDI measurements at longer wavelengths. The best-fitting model visibilities were then used to derive synthetic differential phases, which were compared to the observed ones.
Spherical and aspherical optically thick (i.e one-component) and optically thin (i.e., two-component) models were tested. The best-fitting model (Fig. 3) consists of (i) a uniform disc (UD) that represents the central star, and (ii) an extended centrosymmetric Gaussian distribution that represents the envelope. Furthermore, to account for the non-zero differential phases at long baselines, (iii) a third component corresponding to a Dirac delta function was added. This geometric model is defined by six parameters listed in Table 3 with the resulting best-fitting values (or range of values for wavelength-dependency). Because the angular information of the 2007 observations is limited, we were not able to apply the same 2D model fitting strategy as above to those data (see Sect. 4). Observed and modelled visibilities and differential phases are displayed in the right panel of Fig. 2. We note a very good agreement between model and observations for the visibilities and for the differential phases. The model flux ratios of the Gaussian envelope and of the blob over the central star are plotted in Fig. 4. For comparison we show the contributions of relevant molecular and dust species that characterise the spectrum of a C-rich AGB star at these wavelengths (Nowotny et al. 2011). The flux ratio of the blob over the central star follows the shape of the C2H2 contribution, with a slight shift of the minimum towards the shorter wavelengths (where the HCN contribution has a minimum). A weak drop can be recognised around 11.3 μm where the SiC feature is located. The spectral feature in the differential phase (Fig. 2) and the flux ratio (Fig. 4) suggest that the asymmetry originates in the C2H2+HCN layer (8-9 μm region), and possibly also in the SiC-forming region. The features of Fblob/Fstar could be caused by the star or by the nature of the blob. This will be discussed in Sect. 4.
The best-fitting model (reduced χ2 = 0.29, 4 free parameters) yields a FWHM for the Gaussian envelope of 70–130 mas. These values are consistent with single-dish telescope mid-infrared observations by Lagadec et al. (2011) that showed an unresolved source with an angular resolution of ~0.3 arcsec. The model also yields a separation of the point source of 42 mas at an angle of −36°. We derived a K-band diameter of 8 mas (unpublished AMBER observations, PI Ohnaka), i.e. the asymmetric structure is located at about 5 stellar radii (~30 AU assuming 680 pc as distance; Whitelock et al. 2006) inside the envelope of the star. The position of the Delta function has to be treated with caution, because it is derived by fitting data with limited angular coverage. The fit presented here provides one example of a quantitative solution, but more complex morphologies cannot be excluded.
4. Discussion
As already mentioned, a differential phase signature, similar to that observed for R For, was detected for two J-type carbon stars. IRAS 1800-3213, presented by Deroo et al. (2007), shows a signature in the differential phase that is in the same wavelength region (i.e. 8–9 μm) as the one observed for R For. Deroo et al. (2007) mentioned that long baselines probe the part in the atmosphere where dust emission is strongly (spatially) resolved. The authors speculated that the differential phase signature is caused by an offset of the photocentre between the strongly resolved dust region and the unresolved stellar photosphere. This might be explained by a circumbinary disc. The second object, BM Gem, presented by Ohnaka et al. (2008), shows a non-zero differential phase signature between 9–11 μm. The authors interpreted this as due to the presence of a circum-companion disc.
The detected asymmetry for R For excludes the symmetric scenarios 1. and 2. hypothesised by Feast et al. (1984). The plausible explanations are (i) a feature intrinsic to the star, such as a dust blob that moves through the circumstellar environment of R For; or (ii) an unresolved companion that is embedded in the circumstellar envelope.
The dust blob might have been ejected in a preferential direction or randomly, as stated in scenarios 3 and 4. The expansion velocity of the outer envelope of R For is 16.9 km s-1 (Groenewegen et al. 1999). Using the determined separation of 42 mas, and assuming that the blob moved with a constant velocity of 5 km s-1 over the last 30 years (a reasonable value for the inner envelope, predicted by dynamic model computations; Nowotny et al. 2010), it is worthwhile to mention that the event of 1983 would correspond to the moment at which such a structure was formed near the surface of the star. Recent results from investigations of R CrB stars (Jeffers et al. 2012) indicate the presence of dust clouds with different grain-sizes. Nevertheless, Bright et al. (2011) did not detect any differential phase signature for these objects, arguing that the signatures of dust clumps are not strong enough to induce significant spectral signatures like the one we observed. This might not be the case for AGB stars because R CrB stars are much hotter and H-deficient (i.e. no C2H2), therefore carbon nucleation proceeds differently (Goeres & Sedlmayr 1992). IRC+10216 could be a very interesting test-case to check if the clumps can produce a phase signature in carbon stars. Indeed, several dust clumps were detected in the atmosphere of this star (Haniff & Buscher 1998; Weigelt et al. 1998, 2002; Leao et al. 2006) at spatial scales comparable to the one we obtained with the GEM-FIND modelling (~30 AU).
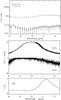 |
Fig. 4 Upper panel: wavelength-dispersed flux ratio values of the best-fitting models. Other panels: contributions by different sources in typical spectra of C-rich AGB stars for the MIDI wavelength range. The synthetic spectra are plotted with continuum-normalised fluxes F/Fc, for detailed descriptions see Aringer et al. (2009) or Nowotny et al. (2010). The middle panel illustrates the individual molecular absorption due to C2H2 and HCN with the help of a hydrostatic model atmosphere, for details we refer to Fig. 4 of Aringer et al. (2009). The lower panel shows the characteristic emission due to circumstellar SiC dust on the basis of a dynamic model atmosphere (e.g. Höfner et al. 2003; Nowotny et al. 2010), computed following the approach of Sacuto et al. (2011) to artificially impose SiC grains. This dust species was detected in the ISO spectrum of R For (Clément et al. 2003). |
The binary option is quite unrealistic for a stellar companion for the following reasons. Archive GALEX observations do not show any evidence of UV excess, which automatically excludes the presence of a warm white dwarf. By translating the flux ratio (see Fig. 4) into magnitudes, this would imply that the companion has a brightness of ~2.2 mag at 12 μm. A faint giant star is very unlikely because such an object would be resolved. A main sequence star also turns out to be too massive and thus would disrupt (because of mass accretion) the spherical symmetry detected at low spatial frequencies for the envelope. We cannot exclude that the companion is a substellar object orbiting the envelope. There are suggestions in literature that such a situation might be common among AGB stars (Soszynski 2007). In this case, only low-mass accretion is expected (Lecavelier Des Etangs 2007), leaving a signature only at the high spatial frequencies probed by long baselines.
The differential phase signature was detected with the same baselines at the same position angles after two years. Assuming that the flux ratio of the point source over the central star is constant between 2007 and 2009 and that the position of the companion as well as the dust blob would change from 2007 to 2009, the following scenarios are possible: (i) for 1 M⊙ central star and a Jupiter mass companion (10-3 M⊙) the orbital period of the companion would be 185 yr and would result in a change of the position angle of ± 4°; (ii) assuming a dust blob that is moving outwards at a uniform velocity of 5 km s-1 would result in a change of the separation of 2.4 mas. In both cases the asymmetry
would be still observable within the two years with the chosen MIDI configuration. Therefore, the available observations do not allow us to reject any of these two asymmetric scenarios.
This Letter presents one interpretation for the detected asymmetry in the dust envelope of R For. More complex morphologies cannot be excluded a priori because of the limited coverage of the available observations. Interferometric imaging with the second-generation instrument VLTI/MATISSE (Lopez et al. 2006) and a detailed polarimetric investigation are needed to clarify the nature of the detected structure.
Online material
Journal of the MIDI observations for the C-star R For.
List of the calibrators.
Parametric description of the geometrical model CircGauss+UD+Dirac.
 |
Fig. 1 uv coverage dispersed in wavelength of the observations acquired during the programs 080.D-0231 (grey-scale), and 084.D-0361 (red-scale). The colour code ranges from 8–12.5 μm, with light colours indicating shorter wavelengths. The sample is restricted to the observations used for this work (marked with (b) and (d) in Table 1). |
 |
Fig. 3 Normalised intensity distribution at 10 μm in the sky plane of the geometric model that best fits the R For MIDI data of 2009. The position of the asymmetric structure is indicated with a circle. The axis orientation is chosen according to the standard with north up and east left. |
Acknowledgments
This work was supported by the Austrian Science Fund FWF under project number AP2300621 and P21988-N16. We thank the referee E. Lagadec for useful comments, and O. Chesneau, B. Aringer, A. Chiavassa for fruitful discussions.
References
- Aringer, B., Girardi, L., Nowotny, W., et al. 2009, A&A, 503, 913 [NASA ADS] [CrossRef] [EDP Sciences] [Google Scholar]
- Barthes, D., Chenevez, J., & Mattei, J. A. 1996, AJ, 111, 2391 [NASA ADS] [CrossRef] [Google Scholar]
- Bright, S. N., Chesneau, O., Clayton, G. C., et al. 2011, MNRAS, 414, 1195 [NASA ADS] [CrossRef] [MathSciNet] [Google Scholar]
- Chandler, A. A., Tatebe, K., Hale, D. D. S., & Townes, C. H. 2007, ApJ, 657, 1042 [NASA ADS] [CrossRef] [Google Scholar]
- Clément, D., Mutschke, H., Klein, R., & Henning, T. 2003, ApJ, 594, 642 [NASA ADS] [CrossRef] [Google Scholar]
- Clayton, C. C. 2012, JAAVSO, in press [Google Scholar]
- Deroo, P., Van Winckel, H., Verhoelst, T., et al. 2007, A&A, 467, 1093 [NASA ADS] [CrossRef] [EDP Sciences] [Google Scholar]
- Dyck, H. M., van Belle, G. T., & Benson, J. A. 1996, AJ, 112, 294 [NASA ADS] [CrossRef] [Google Scholar]
- Feast, M. W., Whitelock, P. A., Catchpole, R. M., et al. 1984, MNRAS, 211, 331 [NASA ADS] [Google Scholar]
- Freytag, B., & Höfner, S. 2008, A&A, 483, 571 [NASA ADS] [CrossRef] [EDP Sciences] [Google Scholar]
- Goeres, A., & Sedlmayr, E. 1992, A&A, 265, 216 [NASA ADS] [Google Scholar]
- Groenewegen, M. A. T., Baas, F., Blommaert, J. A. D. L., et al. 1999, A&AS, 140, 197 [NASA ADS] [CrossRef] [EDP Sciences] [Google Scholar]
- Haniff, C. A., & Buscher, D. F. 1998, A&A, 334, L5 [NASA ADS] [Google Scholar]
- Höfner, S., Gautschy-Loidl, R., Aringer, B., & Jørgensen, U. G. 2003, A&A, 399, 589 [NASA ADS] [CrossRef] [EDP Sciences] [Google Scholar]
- Jaffe, W. 2004, Proc. SPIE, 5491, 715 [NASA ADS] [CrossRef] [Google Scholar]
- Jeffers, S. V., Min, M., Waters, L. B. F. M., et al. 2012, A&A, 539, A56 [NASA ADS] [CrossRef] [EDP Sciences] [Google Scholar]
- Klotz, D., Sacuto, S., Kerschbaum, F., et al. 2012a, A&A, 541, A164 [NASA ADS] [CrossRef] [EDP Sciences] [Google Scholar]
- Klotz, D., Sacuto, S., Paladini, C., Hron, J., & Wachter, G. 2012b [arXiv:1207.2131] [Google Scholar]
- Köhler, R. 2005, AN, 326, 563 [NASA ADS] [Google Scholar]
- Lagadec, E., Verhoelst, T., Mékarnia, D., et al. 2011, MNRAS, 417, 32 [NASA ADS] [CrossRef] [Google Scholar]
- LeBertre, T. 1988, A&A, 190, 79 [NASA ADS] [Google Scholar]
- Leao, I. C., de Laverny, P., Mékarnia, D., de Medeiros, J. R., & Vandame, B. 2006, A&A, 455, 187 [NASA ADS] [CrossRef] [EDP Sciences] [Google Scholar]
- Leao, I. C., de Laverny, P., Chesneau, O., et al. 2007, A&A, 466, 1 [Google Scholar]
- Lecavelier Des Etangs, A. 2007, A&A, 461, 1185 [NASA ADS] [CrossRef] [EDP Sciences] [Google Scholar]
- Lopez, B., Wolf, S., Lagarde, S., et al. 2006, SPIE, 6268, 31 [NASA ADS] [Google Scholar]
- McCarthy, D. W., Howell, R., & Low, F. J. 1980, ApJ, 235, 27 [Google Scholar]
- Mattsson, L., Wahlin, R., & Höfner, S. 2010, A&A, 509, A14 [NASA ADS] [CrossRef] [EDP Sciences] [Google Scholar]
- Monnier, J. D., Tuthill, P. G., & Danchi, W. C. 2000, ApJ, 545, 957 [NASA ADS] [CrossRef] [Google Scholar]
- Nowotny, W., Höfner, S., & Aringer, B. 2010, A&A, 514, A35 [NASA ADS] [CrossRef] [EDP Sciences] [Google Scholar]
- Nowotny, W., Aringer, B., Höfner, S., & Lederer, M. T. 2011, A&A, 529, A129 [NASA ADS] [CrossRef] [EDP Sciences] [Google Scholar]
- Ohnaka, K., Driebe, T., Weigelt, G., & Wittkowski, M. 2007, A&A, 466, 1099 [NASA ADS] [CrossRef] [EDP Sciences] [Google Scholar]
- Ohnaka, K., Izumiura, H., Leinert, Ch., et al. 2008, A&A, 490, 173 [NASA ADS] [CrossRef] [EDP Sciences] [Google Scholar]
- Ragland, S., Traub, W. A., Berger, J.-P., et al. 2006, ApJ, 652, 650 [NASA ADS] [CrossRef] [Google Scholar]
- Sacuto, S., Aringer, B., Hron, J., et al. 2011, A&A, 525, A4 [Google Scholar]
- Samus, N. N., Durlevich, O. V., et al. 2009, VizieR Online Data Catalog, 1, 2025 [Google Scholar]
- Soszynski, I. 2007, ApJ, 660, 1486 [NASA ADS] [CrossRef] [Google Scholar]
- Tubbs, R. N., Meisner, J. A., Bakker, E. J., & Albrecht, S. 2004, Proc. SPIE, 5491, 588 [NASA ADS] [CrossRef] [Google Scholar]
- Tuthill, P. G., Monnier, J. D., Danchi, W. C., & Lopez, B. 2000, ApJ, 543, 284 [NASA ADS] [CrossRef] [Google Scholar]
- Weigelt, G., Balega, Y., Bloecker, T., et al. 1998, A&A, 333, 51 [Google Scholar]
- Weigelt, G., Balega, Y. Y., Hofmann, K.-H., & Preibisch, T. 2002, A&A, 392, 937 [NASA ADS] [CrossRef] [EDP Sciences] [Google Scholar]
- Winters, J. M., Fleischer, A. J., Gauger, A., & Sedlmayr, E. 1994, A&A, 290, 623 [NASA ADS] [Google Scholar]
- Whitelock, P. A., Feast, M. W., Marang, F., & Overbeek, M. D. 1997, MNRAS, 288, 512 [NASA ADS] [CrossRef] [Google Scholar]
- Whitelock, P. A., Feast, M. W., Marang, F., & Groenewegen, M. A. T. 2006, MNRAS, 369, 751 [NASA ADS] [CrossRef] [EDP Sciences] [Google Scholar]
- Woitke, P., & Niccolini, G. 2005, A&A, 433, 1101 [NASA ADS] [CrossRef] [EDP Sciences] [Google Scholar]
All Tables
All Figures
|
Fig. 2 The shaded-region show the calibrated visibilities (upper panels) and differential phases (lower panels) versus wavelength for the selected observations of 2007 (left) and 2009 (right). The overplotted lines show the best-fitting model (details in Sect. 3). |
| In the text | |
|
Fig. 4 Upper panel: wavelength-dispersed flux ratio values of the best-fitting models. Other panels: contributions by different sources in typical spectra of C-rich AGB stars for the MIDI wavelength range. The synthetic spectra are plotted with continuum-normalised fluxes F/Fc, for detailed descriptions see Aringer et al. (2009) or Nowotny et al. (2010). The middle panel illustrates the individual molecular absorption due to C2H2 and HCN with the help of a hydrostatic model atmosphere, for details we refer to Fig. 4 of Aringer et al. (2009). The lower panel shows the characteristic emission due to circumstellar SiC dust on the basis of a dynamic model atmosphere (e.g. Höfner et al. 2003; Nowotny et al. 2010), computed following the approach of Sacuto et al. (2011) to artificially impose SiC grains. This dust species was detected in the ISO spectrum of R For (Clément et al. 2003). |
| In the text | |
|
Fig. 1 uv coverage dispersed in wavelength of the observations acquired during the programs 080.D-0231 (grey-scale), and 084.D-0361 (red-scale). The colour code ranges from 8–12.5 μm, with light colours indicating shorter wavelengths. The sample is restricted to the observations used for this work (marked with (b) and (d) in Table 1). |
| In the text | |
|
Fig. 3 Normalised intensity distribution at 10 μm in the sky plane of the geometric model that best fits the R For MIDI data of 2009. The position of the asymmetric structure is indicated with a circle. The axis orientation is chosen according to the standard with north up and east left. |
| In the text | |
Current usage metrics show cumulative count of Article Views (full-text article views including HTML views, PDF and ePub downloads, according to the available data) and Abstracts Views on Vision4Press platform.
Data correspond to usage on the plateform after 2015. The current usage metrics is available 48-96 hours after online publication and is updated daily on week days.
Initial download of the metrics may take a while.