Fig. 4
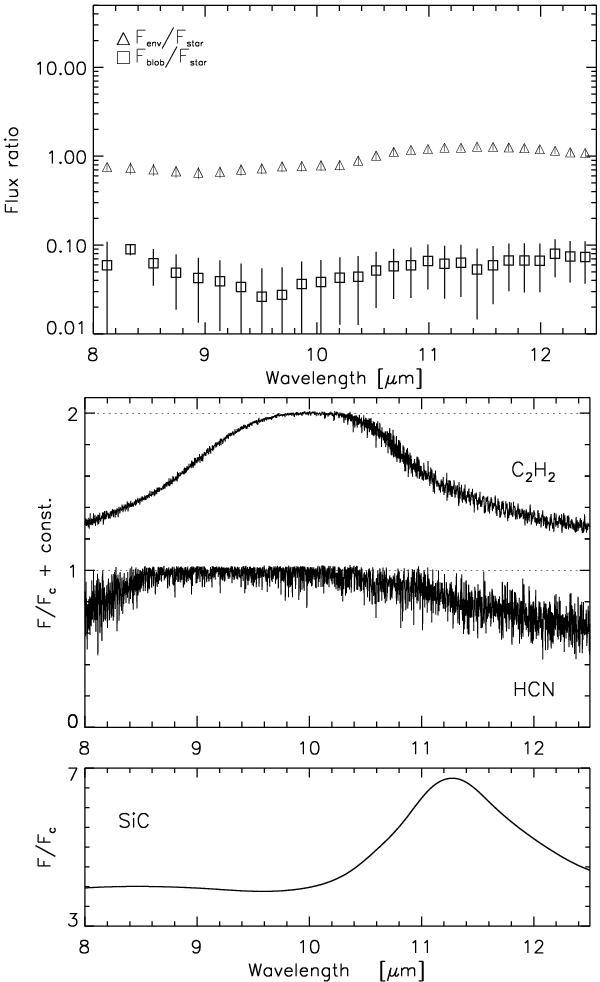
Upper panel: wavelength-dispersed flux ratio values of the best-fitting models. Other panels: contributions by different sources in typical spectra of C-rich AGB stars for the MIDI wavelength range. The synthetic spectra are plotted with continuum-normalised fluxes F/Fc, for detailed descriptions see Aringer et al. (2009) or Nowotny et al. (2010). The middle panel illustrates the individual molecular absorption due to C2H2 and HCN with the help of a hydrostatic model atmosphere, for details we refer to Fig. 4 of Aringer et al. (2009). The lower panel shows the characteristic emission due to circumstellar SiC dust on the basis of a dynamic model atmosphere (e.g. Höfner et al. 2003; Nowotny et al. 2010), computed following the approach of Sacuto et al. (2011) to artificially impose SiC grains. This dust species was detected in the ISO spectrum of R For (Clément et al. 2003).
Current usage metrics show cumulative count of Article Views (full-text article views including HTML views, PDF and ePub downloads, according to the available data) and Abstracts Views on Vision4Press platform.
Data correspond to usage on the plateform after 2015. The current usage metrics is available 48-96 hours after online publication and is updated daily on week days.
Initial download of the metrics may take a while.