Fig. 1
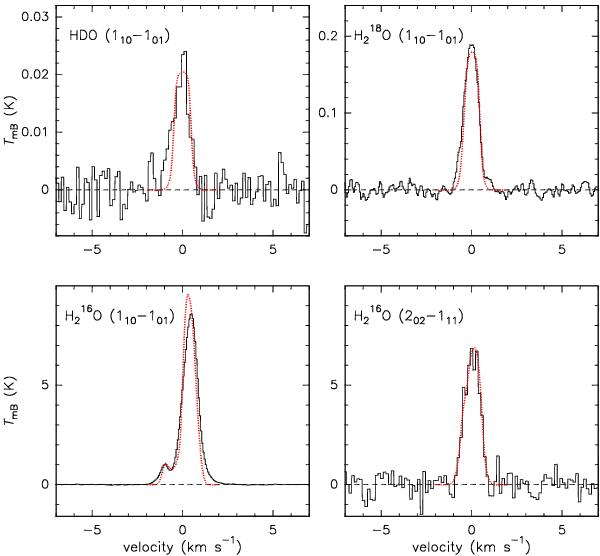
HIFI spectra of comet C/2009 P1 (Garradd) observed on 6 October 2011 with the HRS. HDO (509 GHz), H2O (557 GHz), and  (548 GHz) 110–101 spectra are the average of single-point measurements. The spectrum of the H2O 202–111 line at 988 GHz is extracted from the map, by averaging data at offsets <10′′ from the peak. The velocity scale is given with respect to the comet rest frame. Synthetic line profiles obtained with 30% extended production (see text) are shown by red dotted lines. Gas acceleration (velocity increasing from 0.48 km s-1 to 0.58 km s-1 from r = 104 km to 105 km) is considered to fit more closely the wings of the profiles (Combi et al. 2004).
Current usage metrics show cumulative count of Article Views (full-text article views including HTML views, PDF and ePub downloads, according to the available data) and Abstracts Views on Vision4Press platform.
Data correspond to usage on the plateform after 2015. The current usage metrics is available 48-96 hours after online publication and is updated daily on week days.
Initial download of the metrics may take a while.