Fig. 4
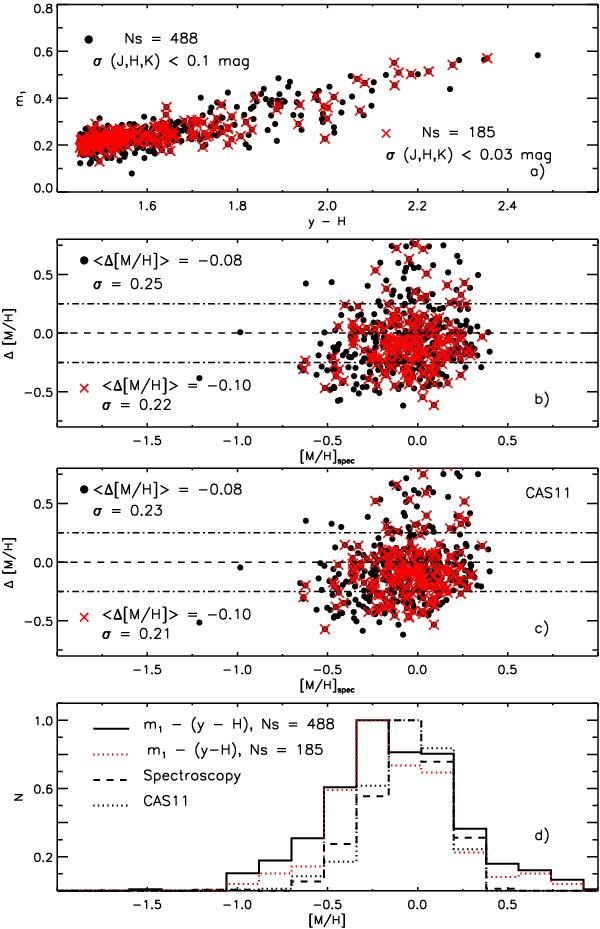
Panel a) selected field dwarf stars from the sample of CAS11 plotted in the unreddened m1, y − H plane (Ns = 488, filled dots). Stars selected for σJ,H,K < 0.03 mag are marked with red crosses (Ns = 185). Panel b) difference between photometric and spectroscopic metallicities, plotted versus the spectroscopic metallicity for the 488 field dwarfs. Photometric metallicities are based on the m1, y − H MIC relation. Panel c) difference between photometric metallicities based on our m1, y − H MIC relation and photometric metallicities by CAS11 plotted versus spectroscopic metallicity. Panel d) photometric metallicity distributions for the 488 dwarfs (black solid line) and for the selected 185 stars (red dotted) obtained with the m1, y − H MIC relation, compared to the photometric distribution by CAS11 (black dotted) and to the spectroscopic distribution (black dashed).
Current usage metrics show cumulative count of Article Views (full-text article views including HTML views, PDF and ePub downloads, according to the available data) and Abstracts Views on Vision4Press platform.
Data correspond to usage on the plateform after 2015. The current usage metrics is available 48-96 hours after online publication and is updated daily on week days.
Initial download of the metrics may take a while.