Free Access
Fig. 1
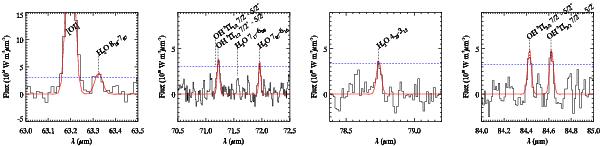
PACS spectrum (continuum-subtracted) of selected lines. The (blue) dashed line indicates the root mean square of the baseline multiplied by three. The presented spectrum has been smoothed (smooth width = two bins) for clarity. The red line is a Gaussian fit to the detected lines.
Current usage metrics show cumulative count of Article Views (full-text article views including HTML views, PDF and ePub downloads, according to the available data) and Abstracts Views on Vision4Press platform.
Data correspond to usage on the plateform after 2015. The current usage metrics is available 48-96 hours after online publication and is updated daily on week days.
Initial download of the metrics may take a while.