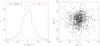
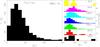
Fig. 4
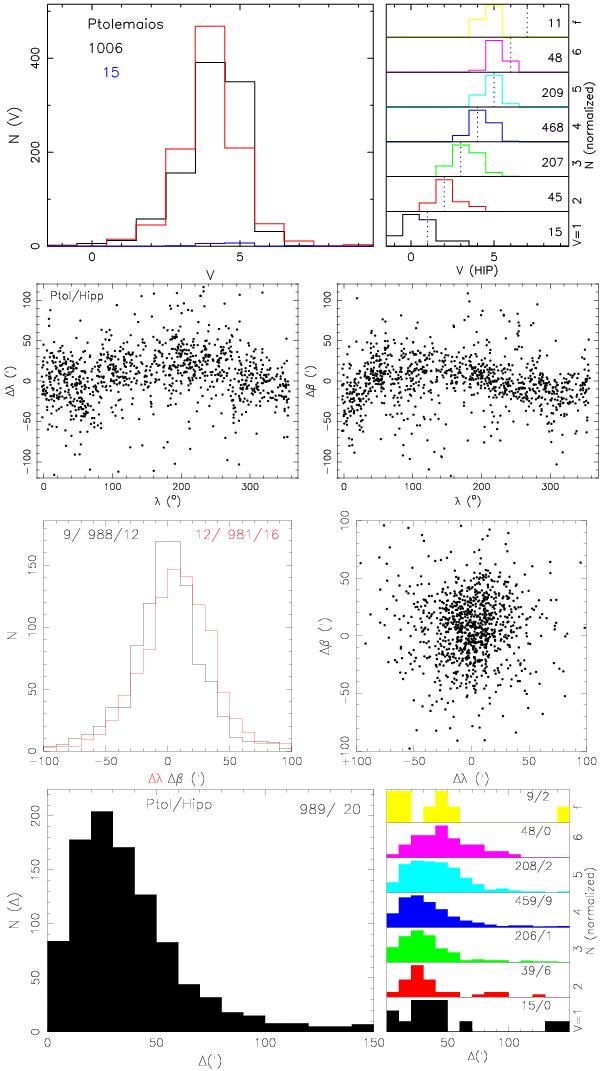
Magnitude and position errors and their correlations of Ptolemaios. The top graph shows the distributions of magnitudes according to Ptolemaios (7 = faint, 9 = nebulous) for securely identified stars (identification flags I − 1,2, red), for not securely identified stars (flags 3, 4, blue), and of the magnitudes in the Hipparcos Catalogue for all secure identifications (black) in the large frame, and for each magnitude according to Ptolemaios in the small frames. The middle frames show the errors in longitude and latitude as a function of longitude and of one another, and histograms of the position errors of the securely identified stars separately for the longitude (red) and latitude (black). The numbers indicate stars within the frame (middle) and outside the frame to the left or right. The lower frame shows the distribution of the position angles Δ, for all securely identified entries in the large frame, of for each magnitude according to Ptolemaios separately in the small frames. The numbers indicate the number of entries within/outside the frame.
Current usage metrics show cumulative count of Article Views (full-text article views including HTML views, PDF and ePub downloads, according to the available data) and Abstracts Views on Vision4Press platform.
Data correspond to usage on the plateform after 2015. The current usage metrics is available 48-96 hours after online publication and is updated daily on week days.
Initial download of the metrics may take a while.