Fig. 2
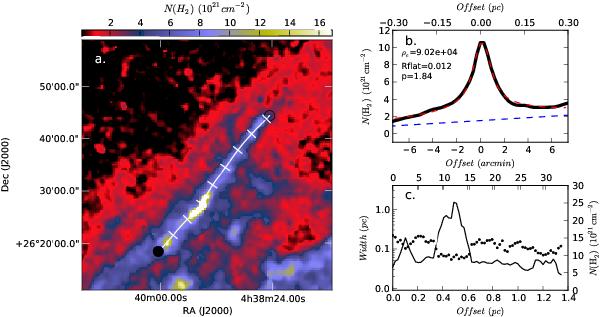
TMC-1N column density map and filament profile derived from WFCAM extinction map. a) Column density map. The part of filament used in the fitting is marked with white line (based on the Herschel column density map in Fig. 3). b) Average column density profile of the filament (black line), fitted Plummer profile (red dashed line) and the baseline of the fit (blue dashed line). Values for fitted Plummer parameters ρc, Rflat, and p are marked in the figure. c) FWHM values (black circles and left hand scale) and column density along the ridge of the filament (solid line and the right hand scale).
Current usage metrics show cumulative count of Article Views (full-text article views including HTML views, PDF and ePub downloads, according to the available data) and Abstracts Views on Vision4Press platform.
Data correspond to usage on the plateform after 2015. The current usage metrics is available 48-96 hours after online publication and is updated daily on week days.
Initial download of the metrics may take a while.