Fig. 15
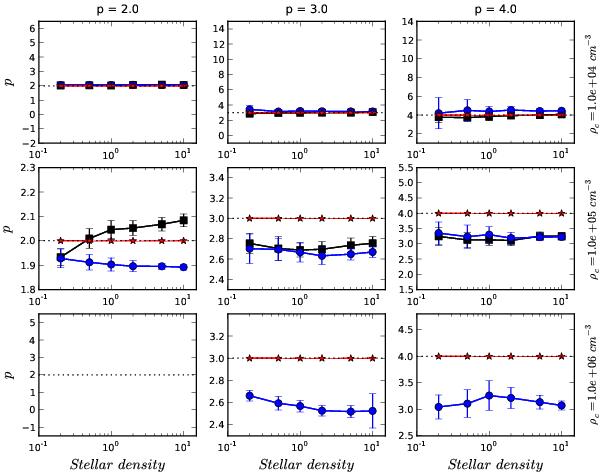
Plummer p parameter derived from simulated extinction observations without noise. Different central densities are shown on different lines: 104 (cm-3) (uppermost frames), 105 (middle frames), and 106 (bottom frames). Symbols and colours denote the used method: method B (black square), method C (blue circle), and method D (red star). Stellar density is given on the x-axis, where 1 means a similar density as in the WFCAM observations of TMC-1N. The true p value (2, 3 or 4) used in the simulations is given on top of each column and also shown as a dashed line in the figures. The derived p value is marked in the figures for each simulated stellar density and method with scale on the y-axis.
Current usage metrics show cumulative count of Article Views (full-text article views including HTML views, PDF and ePub downloads, according to the available data) and Abstracts Views on Vision4Press platform.
Data correspond to usage on the plateform after 2015. The current usage metrics is available 48-96 hours after online publication and is updated daily on week days.
Initial download of the metrics may take a while.