Fig. 7
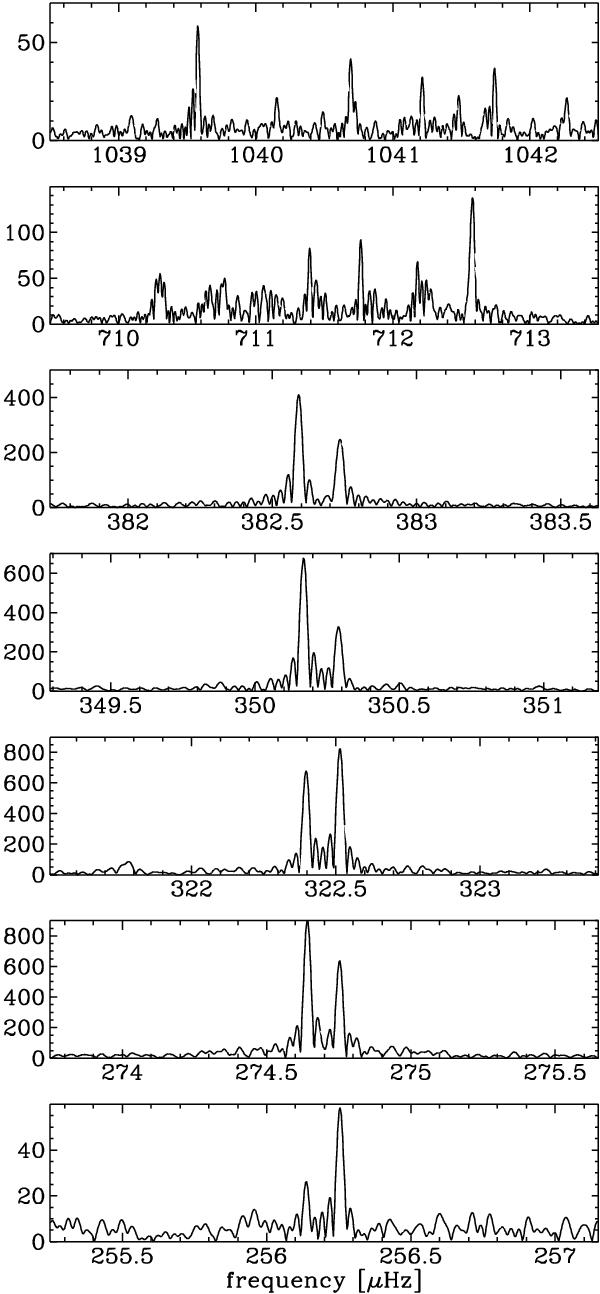
Selected multiplets. The bottom 5 panels show the ~0.13 μHz splitting seen in some of the ℓ = 1 doublets. The strongest pulsations we detect in KIC 11 558 725 are amongst the ℓ = 1 peaks shown here. The top panels show sample regions with sequences of frequencies with splittings in the 0.37–0.58 μHz range. Amplitudes are given in ppm. The significance cut-off amplitude is 17 ppm.
Current usage metrics show cumulative count of Article Views (full-text article views including HTML views, PDF and ePub downloads, according to the available data) and Abstracts Views on Vision4Press platform.
Data correspond to usage on the plateform after 2015. The current usage metrics is available 48-96 hours after online publication and is updated daily on week days.
Initial download of the metrics may take a while.