Free Access
Fig. 6
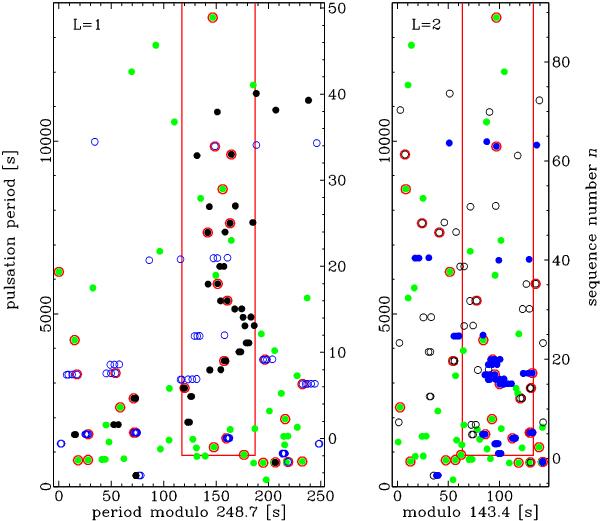
Echelle diagrams of the ℓ = 1 and ℓ = 2 period-spacing sequences. The red rectangles depict the areas of acceptance to these sequences. Single frequencies are plotted in light green, doublets in black, and multiplets in blue (see Table 4). Modes marked with red circles form frequency combinations (Table 5).
Current usage metrics show cumulative count of Article Views (full-text article views including HTML views, PDF and ePub downloads, according to the available data) and Abstracts Views on Vision4Press platform.
Data correspond to usage on the plateform after 2015. The current usage metrics is available 48-96 hours after online publication and is updated daily on week days.
Initial download of the metrics may take a while.