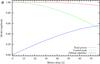
Fig. 5
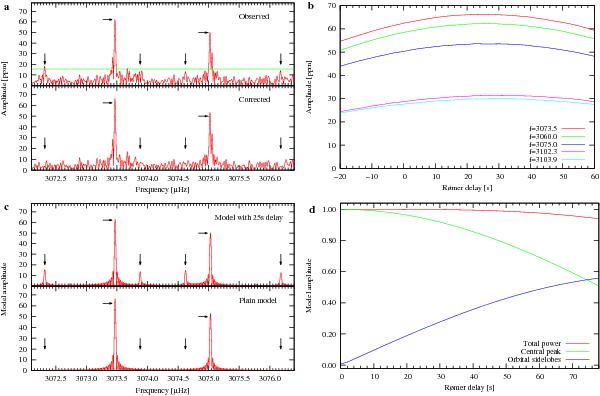
a) The pulsation spectrum KIC 11 558 725 as observed (upper panel), and after correcting for the Rømer delay (lower panel). The line in the upper panel indicates our 4-σ detection limit. b) The amplitude of five pulsation peaks as a function of Rømer correction. c) Same as a), but for a model light curve with the same duration and sampling frequency as the data in a). d) The predicted amplitude of the central peak and first alias as computed for a pure sine function distorted by an increasing Rømer delay. The upper curve indicates the total power of the central peak and the aliases. This sum departs from unity when the unaccounted-for second orbital alias pair starts to contribute. Entries in the legends have the same top-to-bottom order as the curves.
Current usage metrics show cumulative count of Article Views (full-text article views including HTML views, PDF and ePub downloads, according to the available data) and Abstracts Views on Vision4Press platform.
Data correspond to usage on the plateform after 2015. The current usage metrics is available 48-96 hours after online publication and is updated daily on week days.
Initial download of the metrics may take a while.