Free Access
Fig. 4
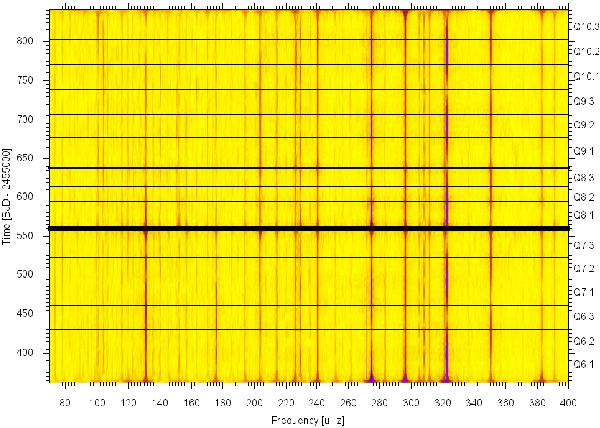
A dynamic Fourier spectrum from quarters Q6 through Q10 computed for 20 day stretches of data. The pronounced beatings show up as resolved frequencies in the Fourier spectrum of the complete data set. The horizontal lines reflect data gaps.
Current usage metrics show cumulative count of Article Views (full-text article views including HTML views, PDF and ePub downloads, according to the available data) and Abstracts Views on Vision4Press platform.
Data correspond to usage on the plateform after 2015. The current usage metrics is available 48-96 hours after online publication and is updated daily on week days.
Initial download of the metrics may take a while.