Free Access
Fig. 4
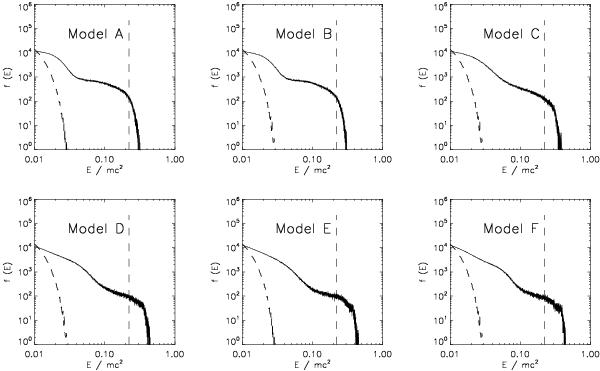
The electron energy distributions (solid lines) at ωpet = 200 as a function of the magnetic field in models A-F with ωce/ωpe = 0.0, 0.1, 0.5, 0.7, 1.0, and 1.3, respectively. For comparison in each panel we plot the initial electron plasma distribution together with the initial monoenergetic beam (dashed lines).
Current usage metrics show cumulative count of Article Views (full-text article views including HTML views, PDF and ePub downloads, according to the available data) and Abstracts Views on Vision4Press platform.
Data correspond to usage on the plateform after 2015. The current usage metrics is available 48-96 hours after online publication and is updated daily on week days.
Initial download of the metrics may take a while.