Fig. 1
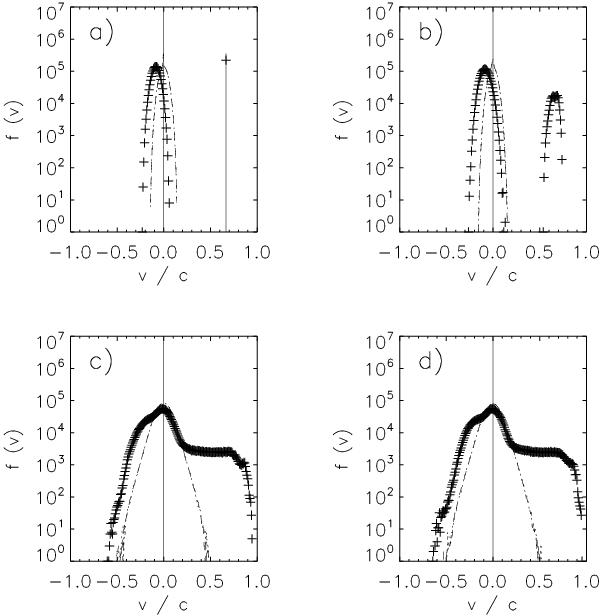
The electron velocity distributions for model E at four different times: at the initial state a), at ωpet = 40 b), at ωpet = 140 c), and ωpet = 200 d). Crosses correspond to f(vz), dotted and dashed lines display f(vx) and f(vy), respectively. Note that f(vx) and f(vy) overlap. The vertical line in the part a) at v/c = 0.666 denotes the monoenergetic electron beam.
Current usage metrics show cumulative count of Article Views (full-text article views including HTML views, PDF and ePub downloads, according to the available data) and Abstracts Views on Vision4Press platform.
Data correspond to usage on the plateform after 2015. The current usage metrics is available 48-96 hours after online publication and is updated daily on week days.
Initial download of the metrics may take a while.