Fig. 3
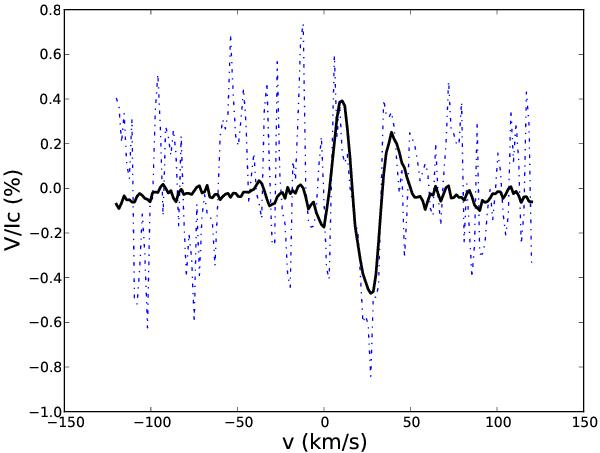
Example of PCA denoising: the original noisy signal Oj(v) (dashed line) for the 612.2 nm line of Ca i, is displayed, together with its projection onto the eigenprofile of matrix C associated with the highest eigenvalue, Pj,1 (full thick line). This last profile already bears a shape very similar to the SLA (or LSD) pseudo-profiles obtained with the whole set of observations, which are displayed in Fig. 1.
Current usage metrics show cumulative count of Article Views (full-text article views including HTML views, PDF and ePub downloads, according to the available data) and Abstracts Views on Vision4Press platform.
Data correspond to usage on the plateform after 2015. The current usage metrics is available 48-96 hours after online publication and is updated daily on week days.
Initial download of the metrics may take a while.