Fig. 1
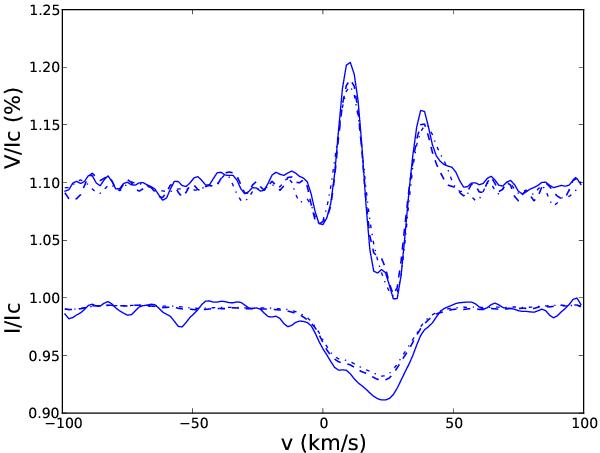
Comparison between LSD (full lines) and SLA (dashed lines) I/Ic and V/Ic pseudo-line profiles for II Peg observations of August 2008. Stokes V profiles have been shifted by 1.1 so the largest amplitude lobe is about 0.1% of Ic for LSD. P1 profiles (dot-dashed) both for I/Ic and V/Ic resulting from the PCA analysis of the data are also displayed for comparison purpose.
Current usage metrics show cumulative count of Article Views (full-text article views including HTML views, PDF and ePub downloads, according to the available data) and Abstracts Views on Vision4Press platform.
Data correspond to usage on the plateform after 2015. The current usage metrics is available 48-96 hours after online publication and is updated daily on week days.
Initial download of the metrics may take a while.