Fig. 3
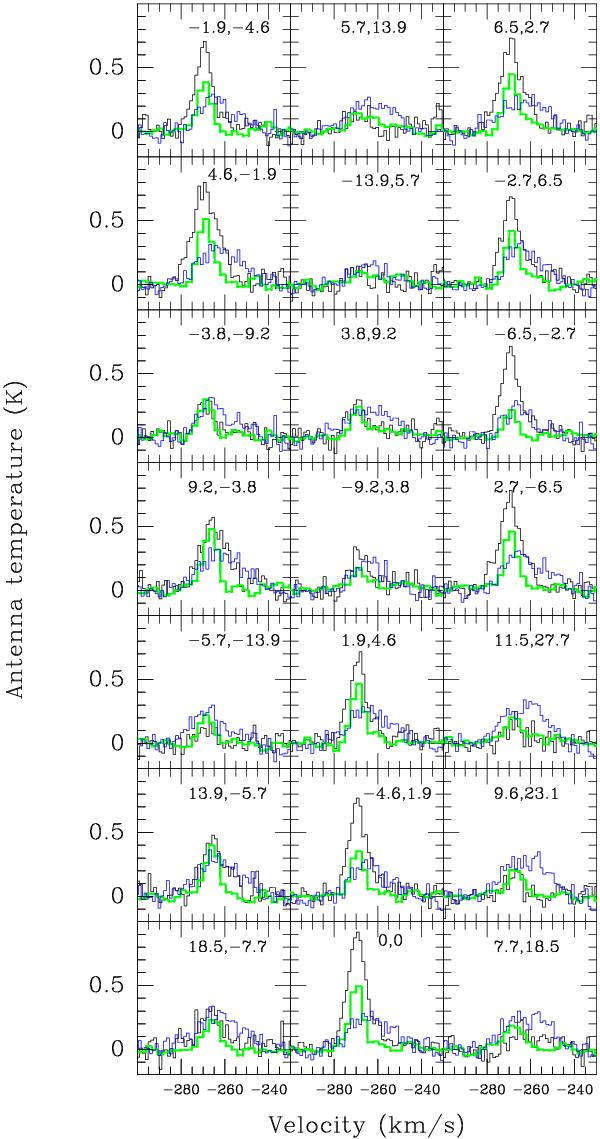
[C ii], CO, and H i spectra of all detected positions at 12′′ resolution. Offsets in arcsec are indicated in the upper right corner of each panel. The order follows that of Table 1from bottom left to upper right. [C ii] is in black, CO in green, and H i is in blue. Y-scale is main beam antenna temperature in Kelvins for [C ii] and CO; H i temperatures need to be multiplied by 150 to obtain true antenna temperatures.
Current usage metrics show cumulative count of Article Views (full-text article views including HTML views, PDF and ePub downloads, according to the available data) and Abstracts Views on Vision4Press platform.
Data correspond to usage on the plateform after 2015. The current usage metrics is available 48-96 hours after online publication and is updated daily on week days.
Initial download of the metrics may take a while.