Fig. 2
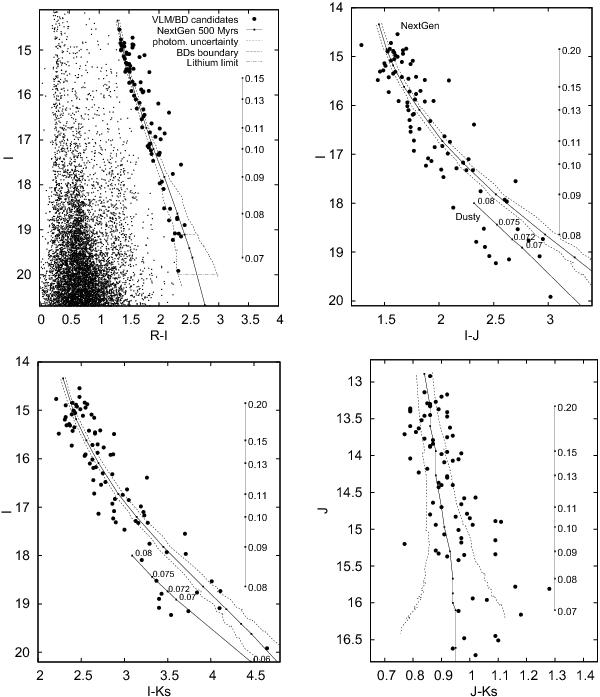
I − (R − I) (top left), I − (I − J) (top right), I − (I − Ks) (bottom left), and J − (J − Ks) (bottom right) colour − magnitude diagrams of optically selected candidates (points) from the TLS and 2MASS/UKIDSS surveys. In all CMDs, we show 500 Myr NextGen isochrones shifted to the distance of the Coma open cluster as solid lines; the same age DUSTY isochrones (lower solid line) are shown in the I − (I − J) and I − (I − Ks) CMDs. The vertical line labelled with stellar mass (M⊙) is the mass scale according to the NextGen (Baraffe et al. 1998) models. The DUSTY isochrones in I − (I − J) and I − (I − Ks) are also marked with stellar mass. The two dashed lines display the uncertainty in the RI-photometry (PSF photometric errors only), which grows with magnitude. The upper horizontal line shows the stellar/substellar boundary and the lower line indicates the lithium burning limit. Field objects (points) from two CCD frames are shown. All objects around the I − (R − I) isochrone have been included in the list of candidates and thus the non-candidates are represented here for demonstration only. Five brown dwarf candidates are located close to or in the substellar domain.
Current usage metrics show cumulative count of Article Views (full-text article views including HTML views, PDF and ePub downloads, according to the available data) and Abstracts Views on Vision4Press platform.
Data correspond to usage on the plateform after 2015. The current usage metrics is available 48-96 hours after online publication and is updated daily on week days.
Initial download of the metrics may take a while.