Fig. 5
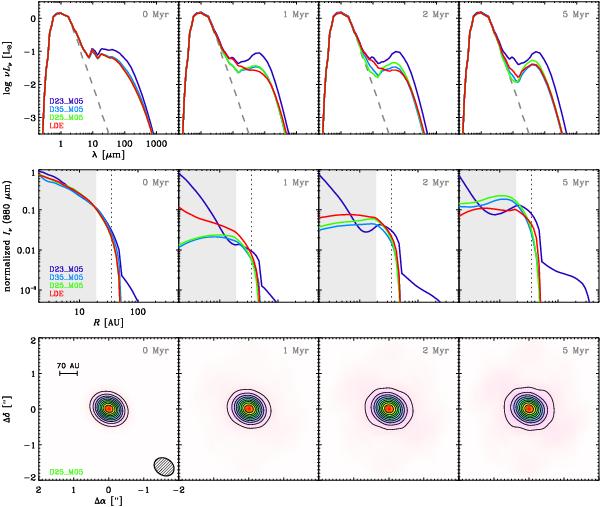
Same as Fig. 4 but for the models which include dead-zones, corresponding to the simulations labeled in the left panels. The dashed vertical line in the central row marks the dead zone radius rdz. The synthesized images in the bottom row correspond to model D25_M05.
Current usage metrics show cumulative count of Article Views (full-text article views including HTML views, PDF and ePub downloads, according to the available data) and Abstracts Views on Vision4Press platform.
Data correspond to usage on the plateform after 2015. The current usage metrics is available 48-96 hours after online publication and is updated daily on week days.
Initial download of the metrics may take a while.