Fig. 4
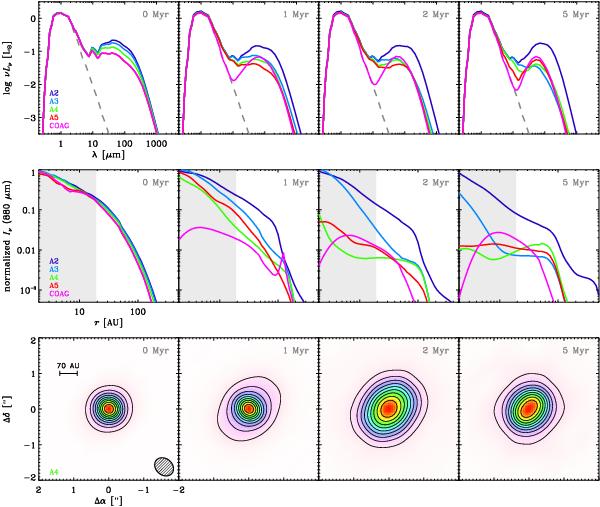
Spectral energy distributions (top row), normalized radial surface brightness profiles at 880 μm (middle row), and synthesized 880 μm images (bottom row) corresponding to the Submillimeter Array setup of Andrews et al. (2011) for the active disk models. The line colors correspond to models A2 to A5 and model COAG, as labeled in the left panels. The dashed grey line in the SEDs represents the stellar photosphere. The columns from left to right correspond to 0, 1, 2, and 5 Myr of evolution. The shaded areas in the central row depict the resolution limits of current (pre-ALMA) interferometers. Only the results for model A4 are shown in the synthesized images, where the contours correspond to 10% levels of the peak brightness and the bar and dashed oval represent the size scale and the beam size, respectively.
Current usage metrics show cumulative count of Article Views (full-text article views including HTML views, PDF and ePub downloads, according to the available data) and Abstracts Views on Vision4Press platform.
Data correspond to usage on the plateform after 2015. The current usage metrics is available 48-96 hours after online publication and is updated daily on week days.
Initial download of the metrics may take a while.